Step 1
Open the single-cell explorer
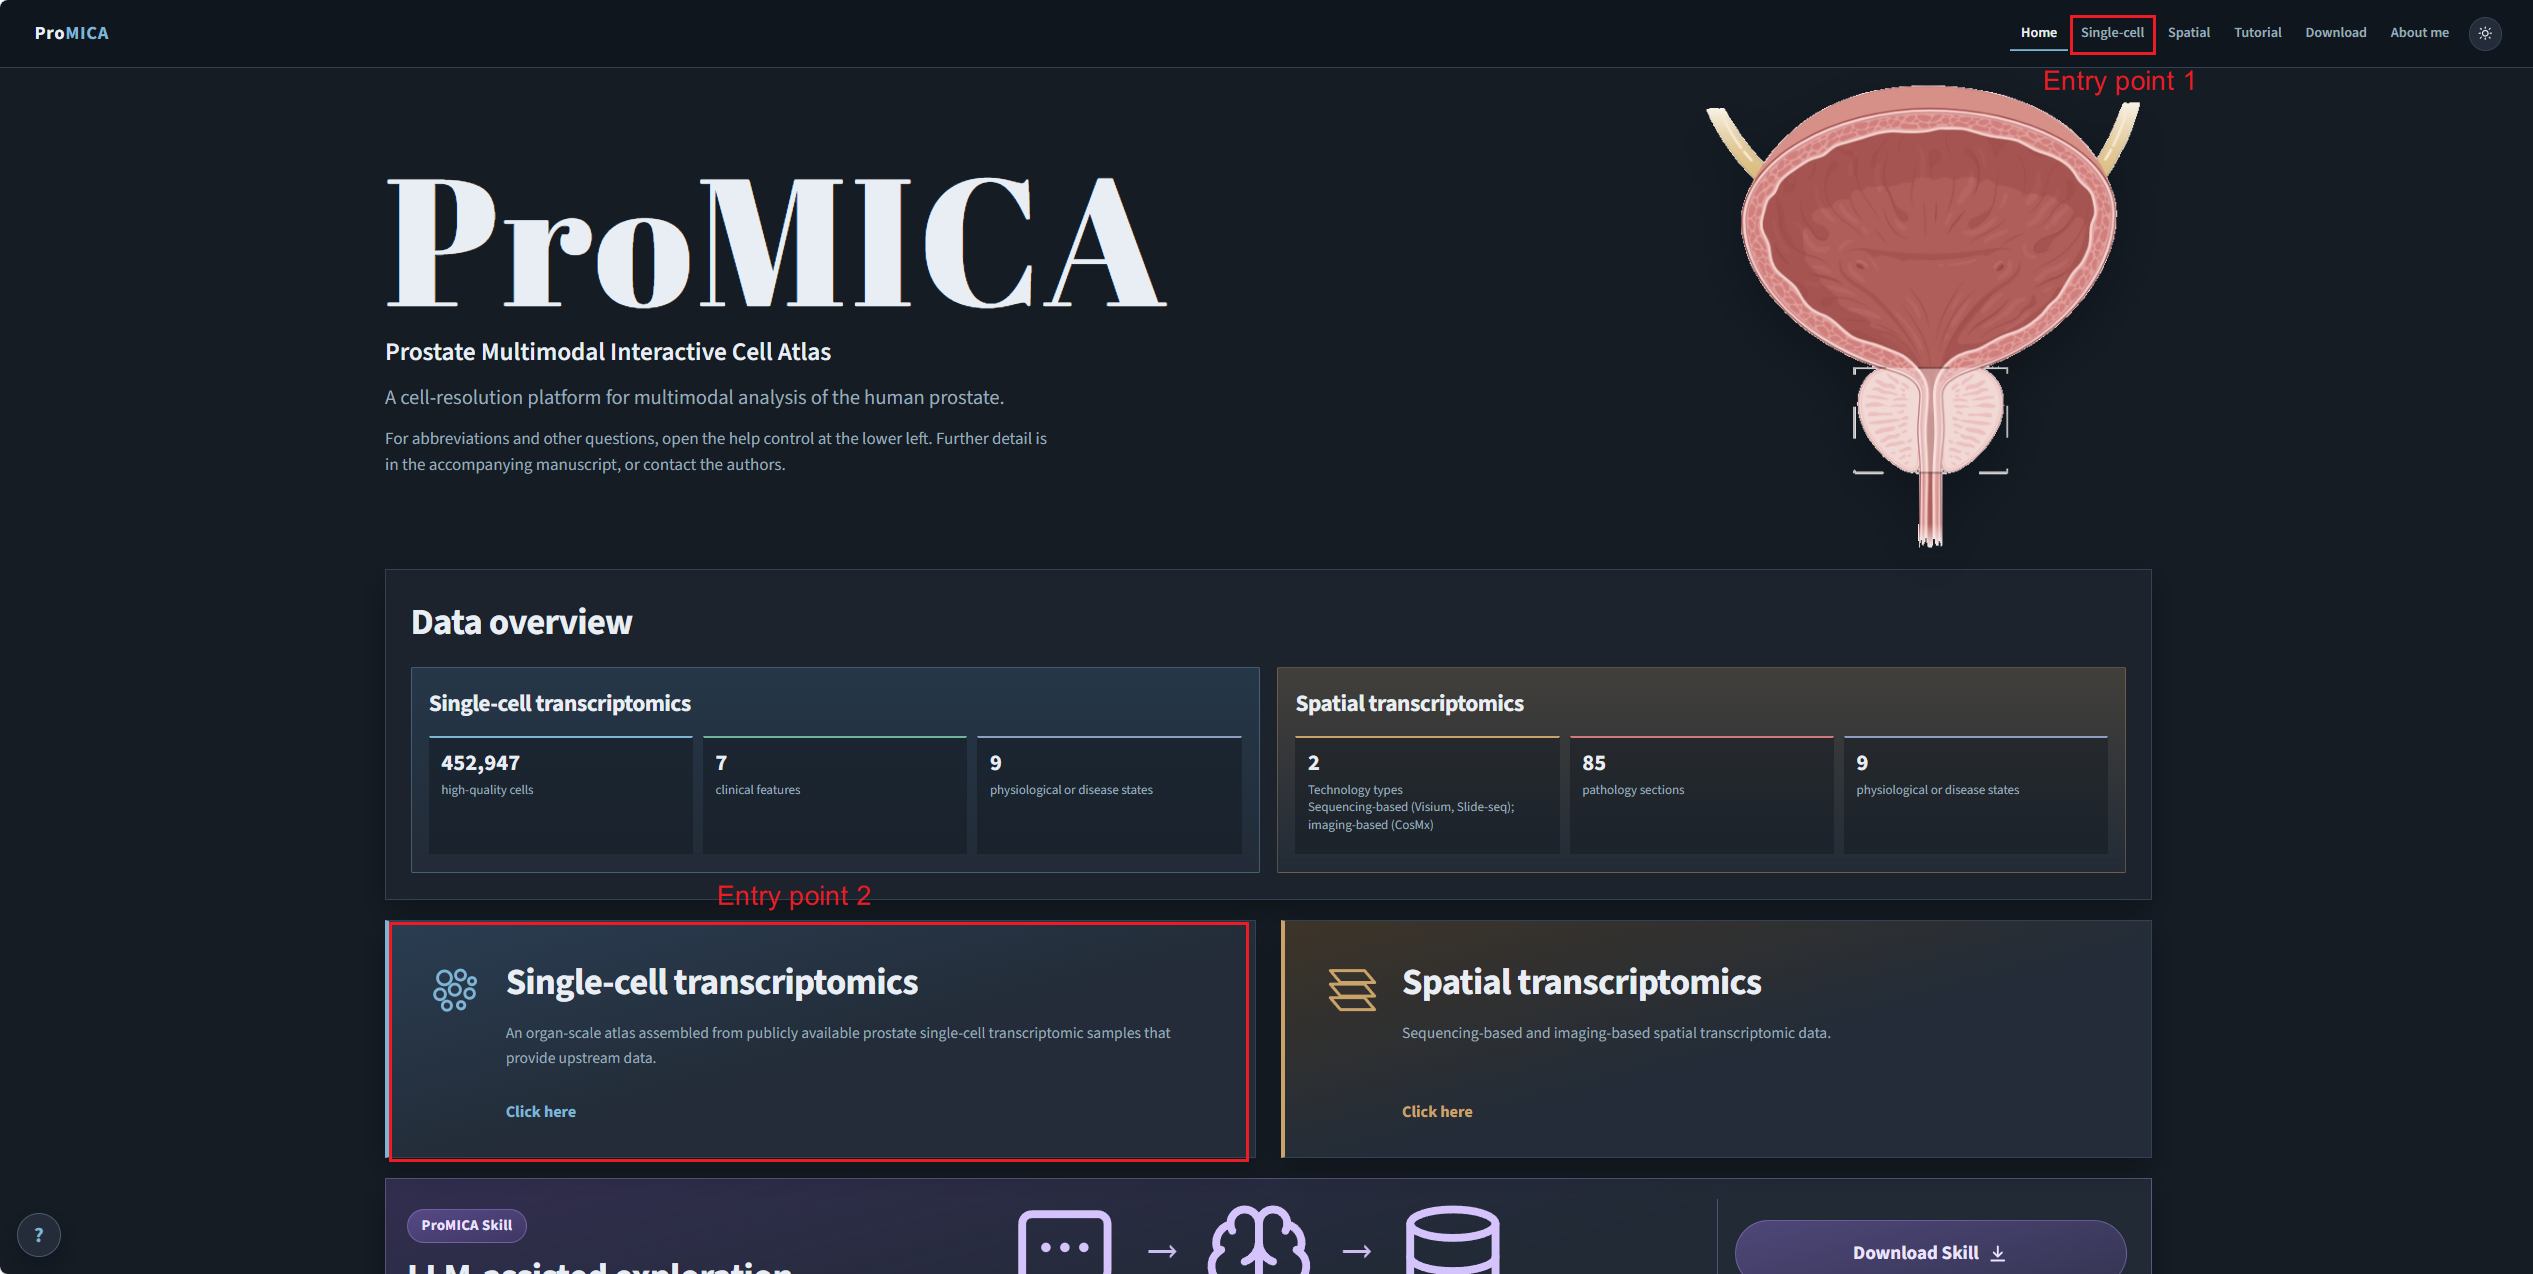
Use Single-cell in the top navigation, or the Single-cell transcriptomics card on the home page.
Tutorial
Follow three visual walkthroughs: the single-cell explorer, the spatial explorer, and the LLM skill.
Open the explorer, colour the UMAP, plot a gene, then run contrast, correlation, or differential analysis.
02Open the explorer, map cell-type annotation on a pathology section, plot a gene, then run contrast or colocalization.
03Explore the atlas through an AI-assisted approach.
Walkthrough 01
Start from the home page, colour the atlas by annotation, search a gene, and continue into contrast, correlation, or differential analysis.
Use Single-cell in the top navigation, or the Single-cell transcriptomics card on the home page.
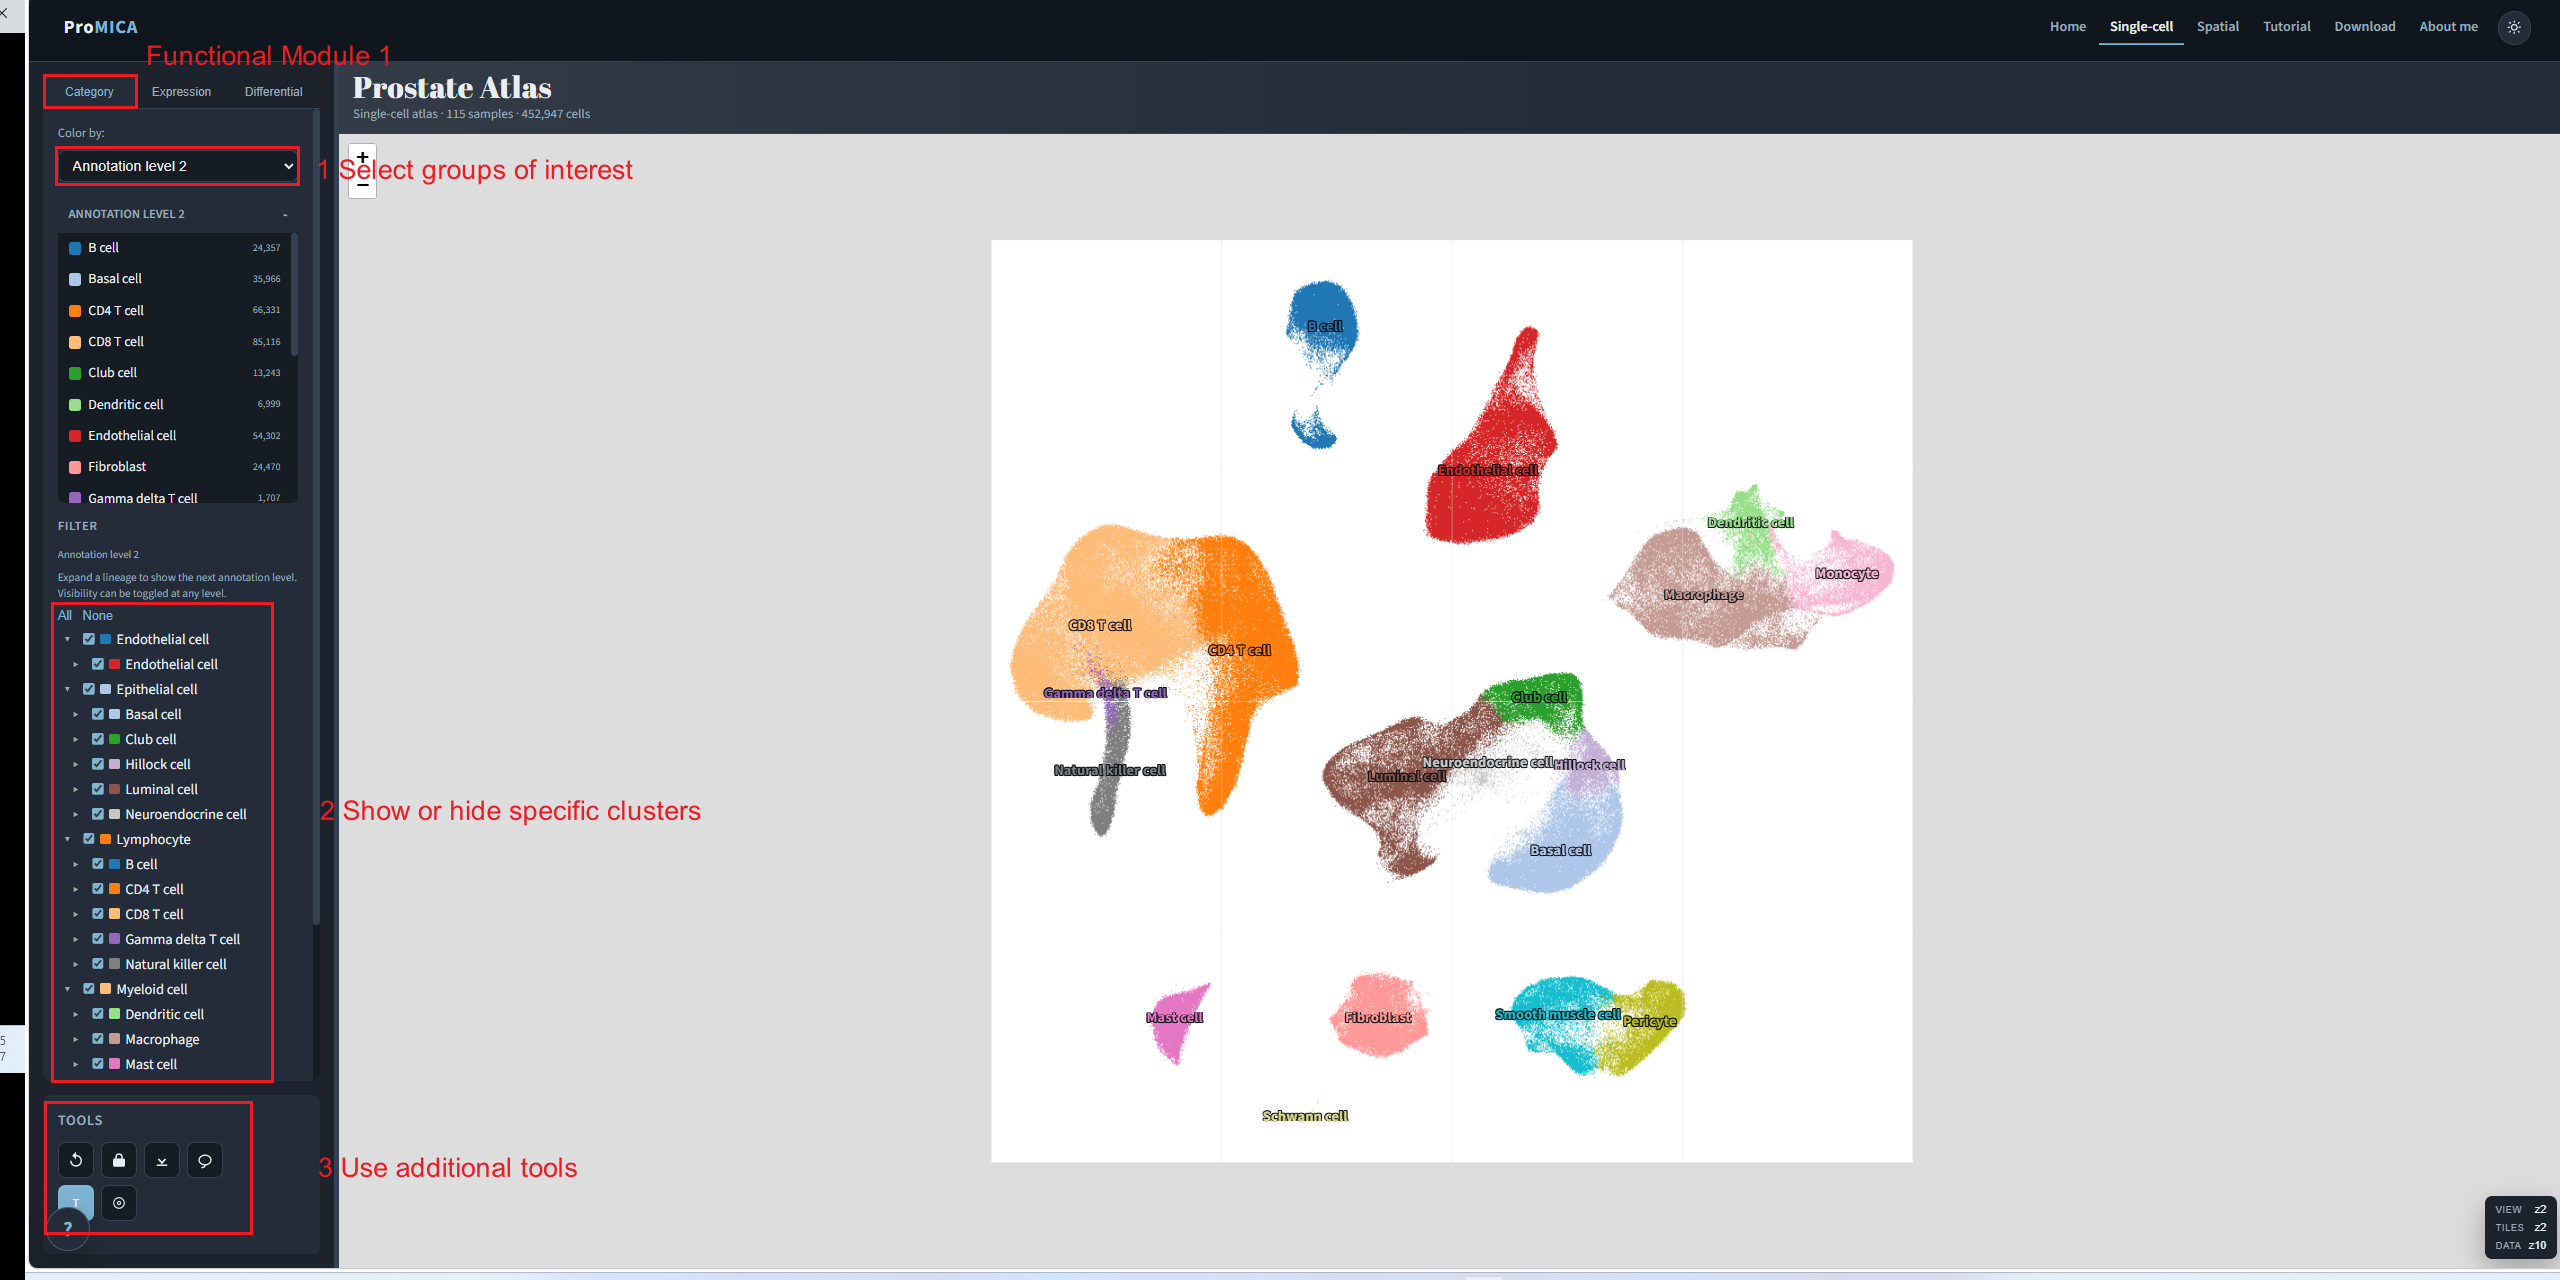
On the Category tab, choose an annotation level, show or hide clusters in the filter tree, and use the map tools as needed.
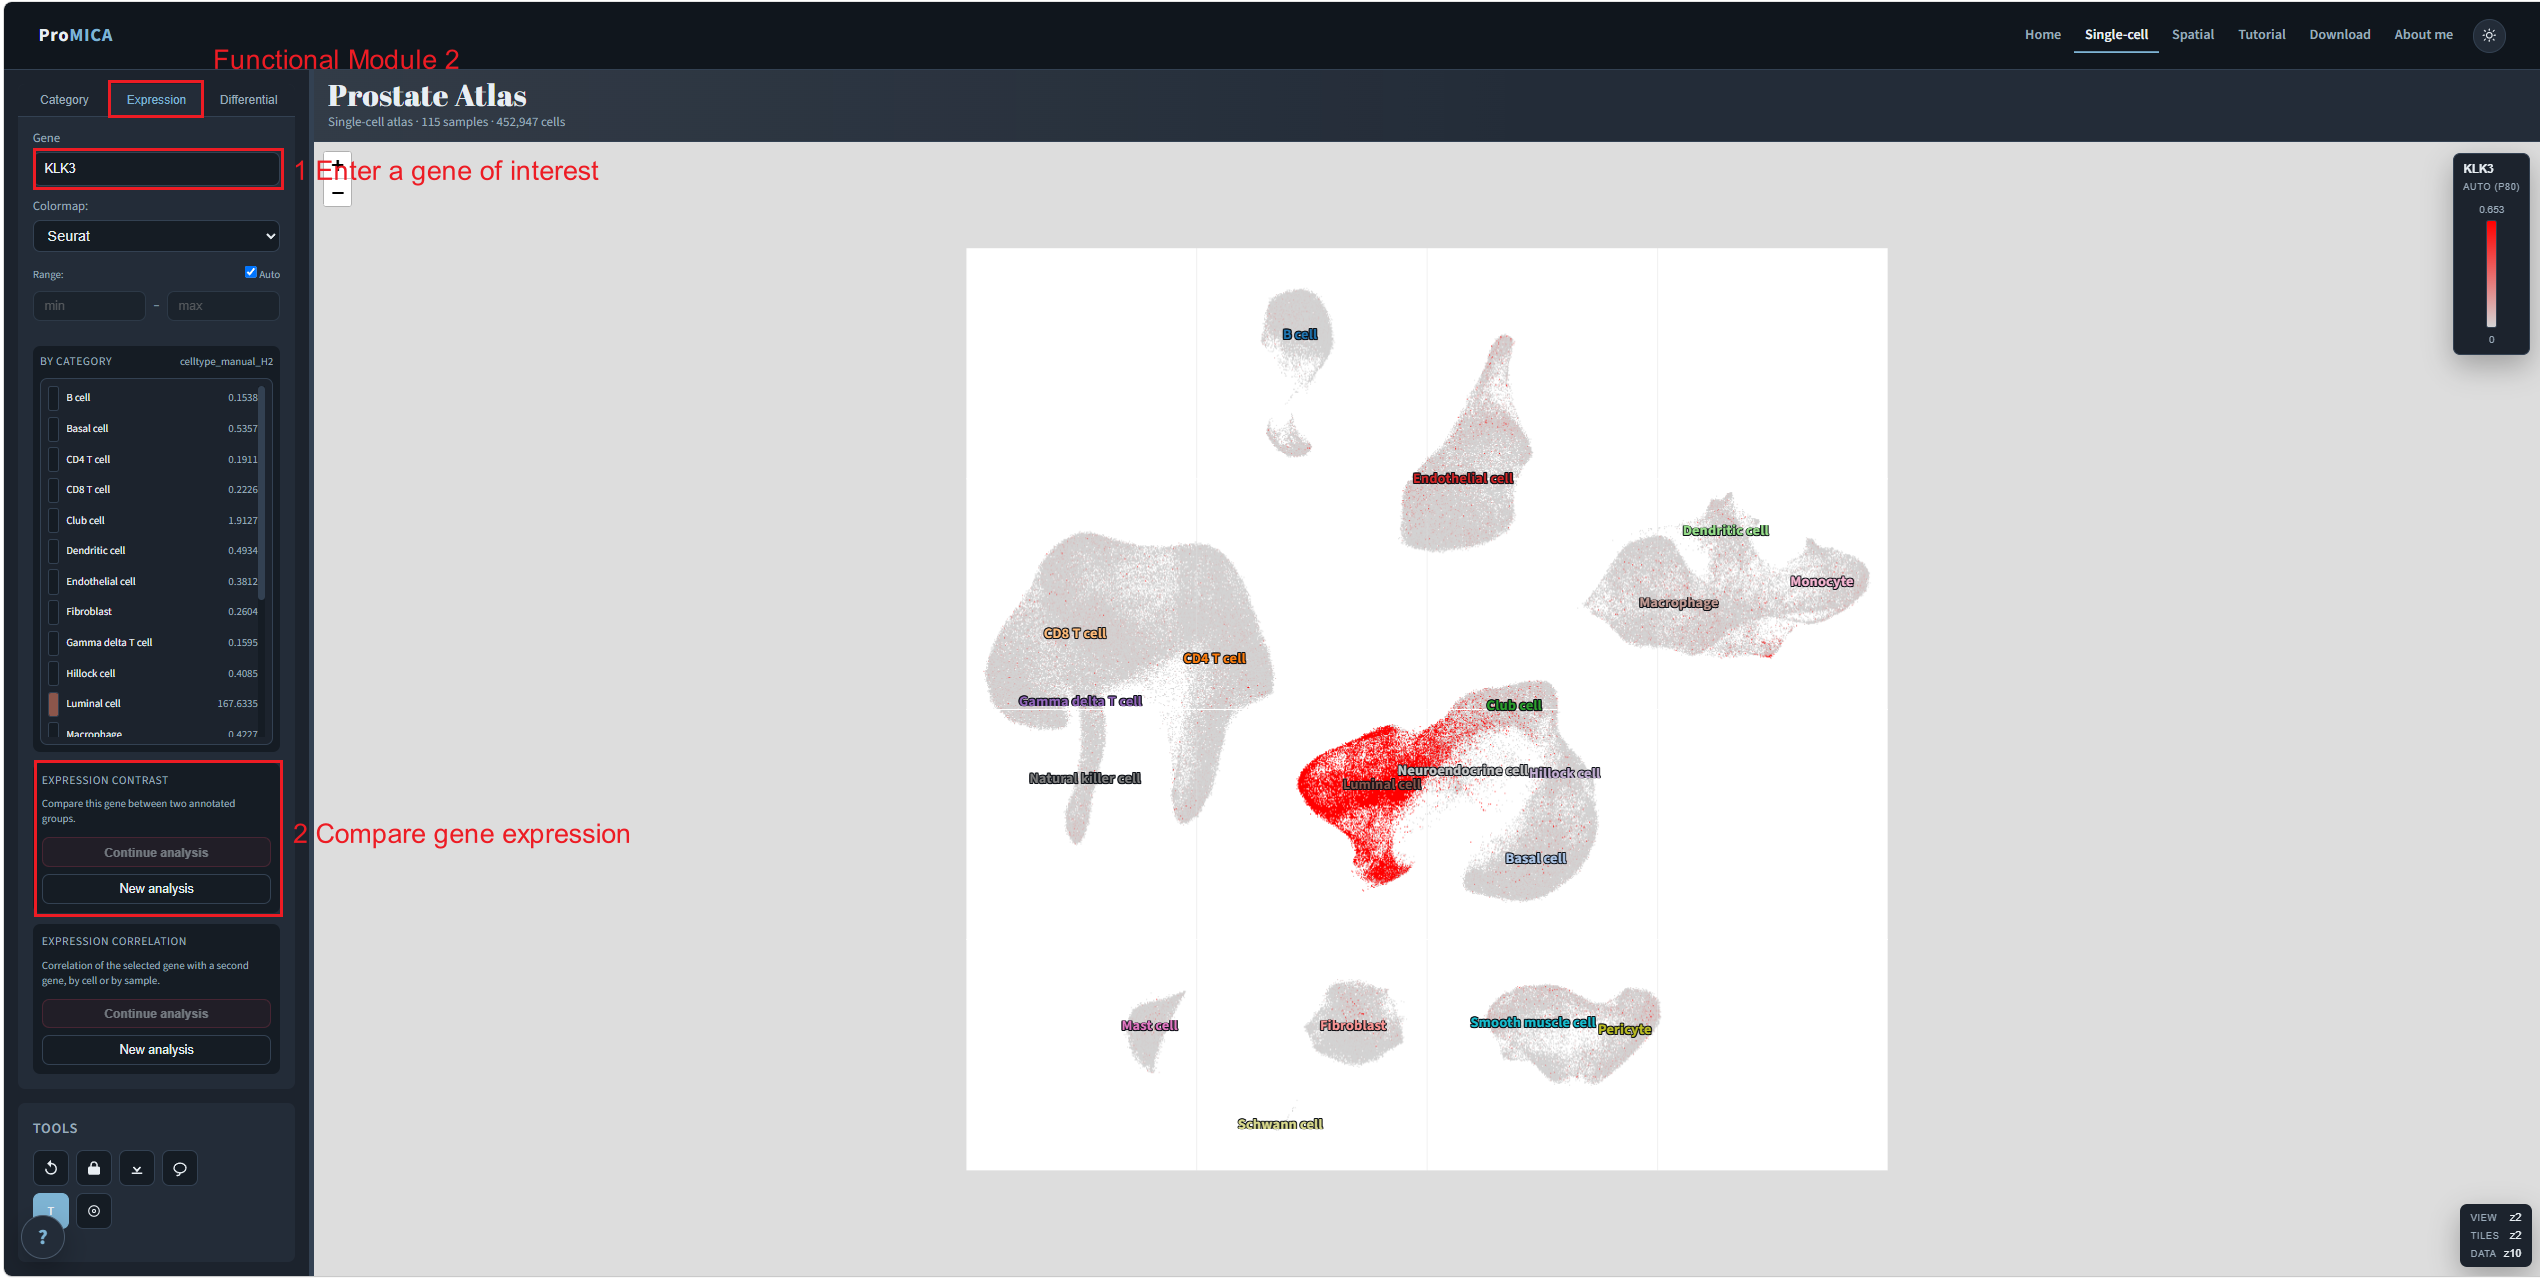
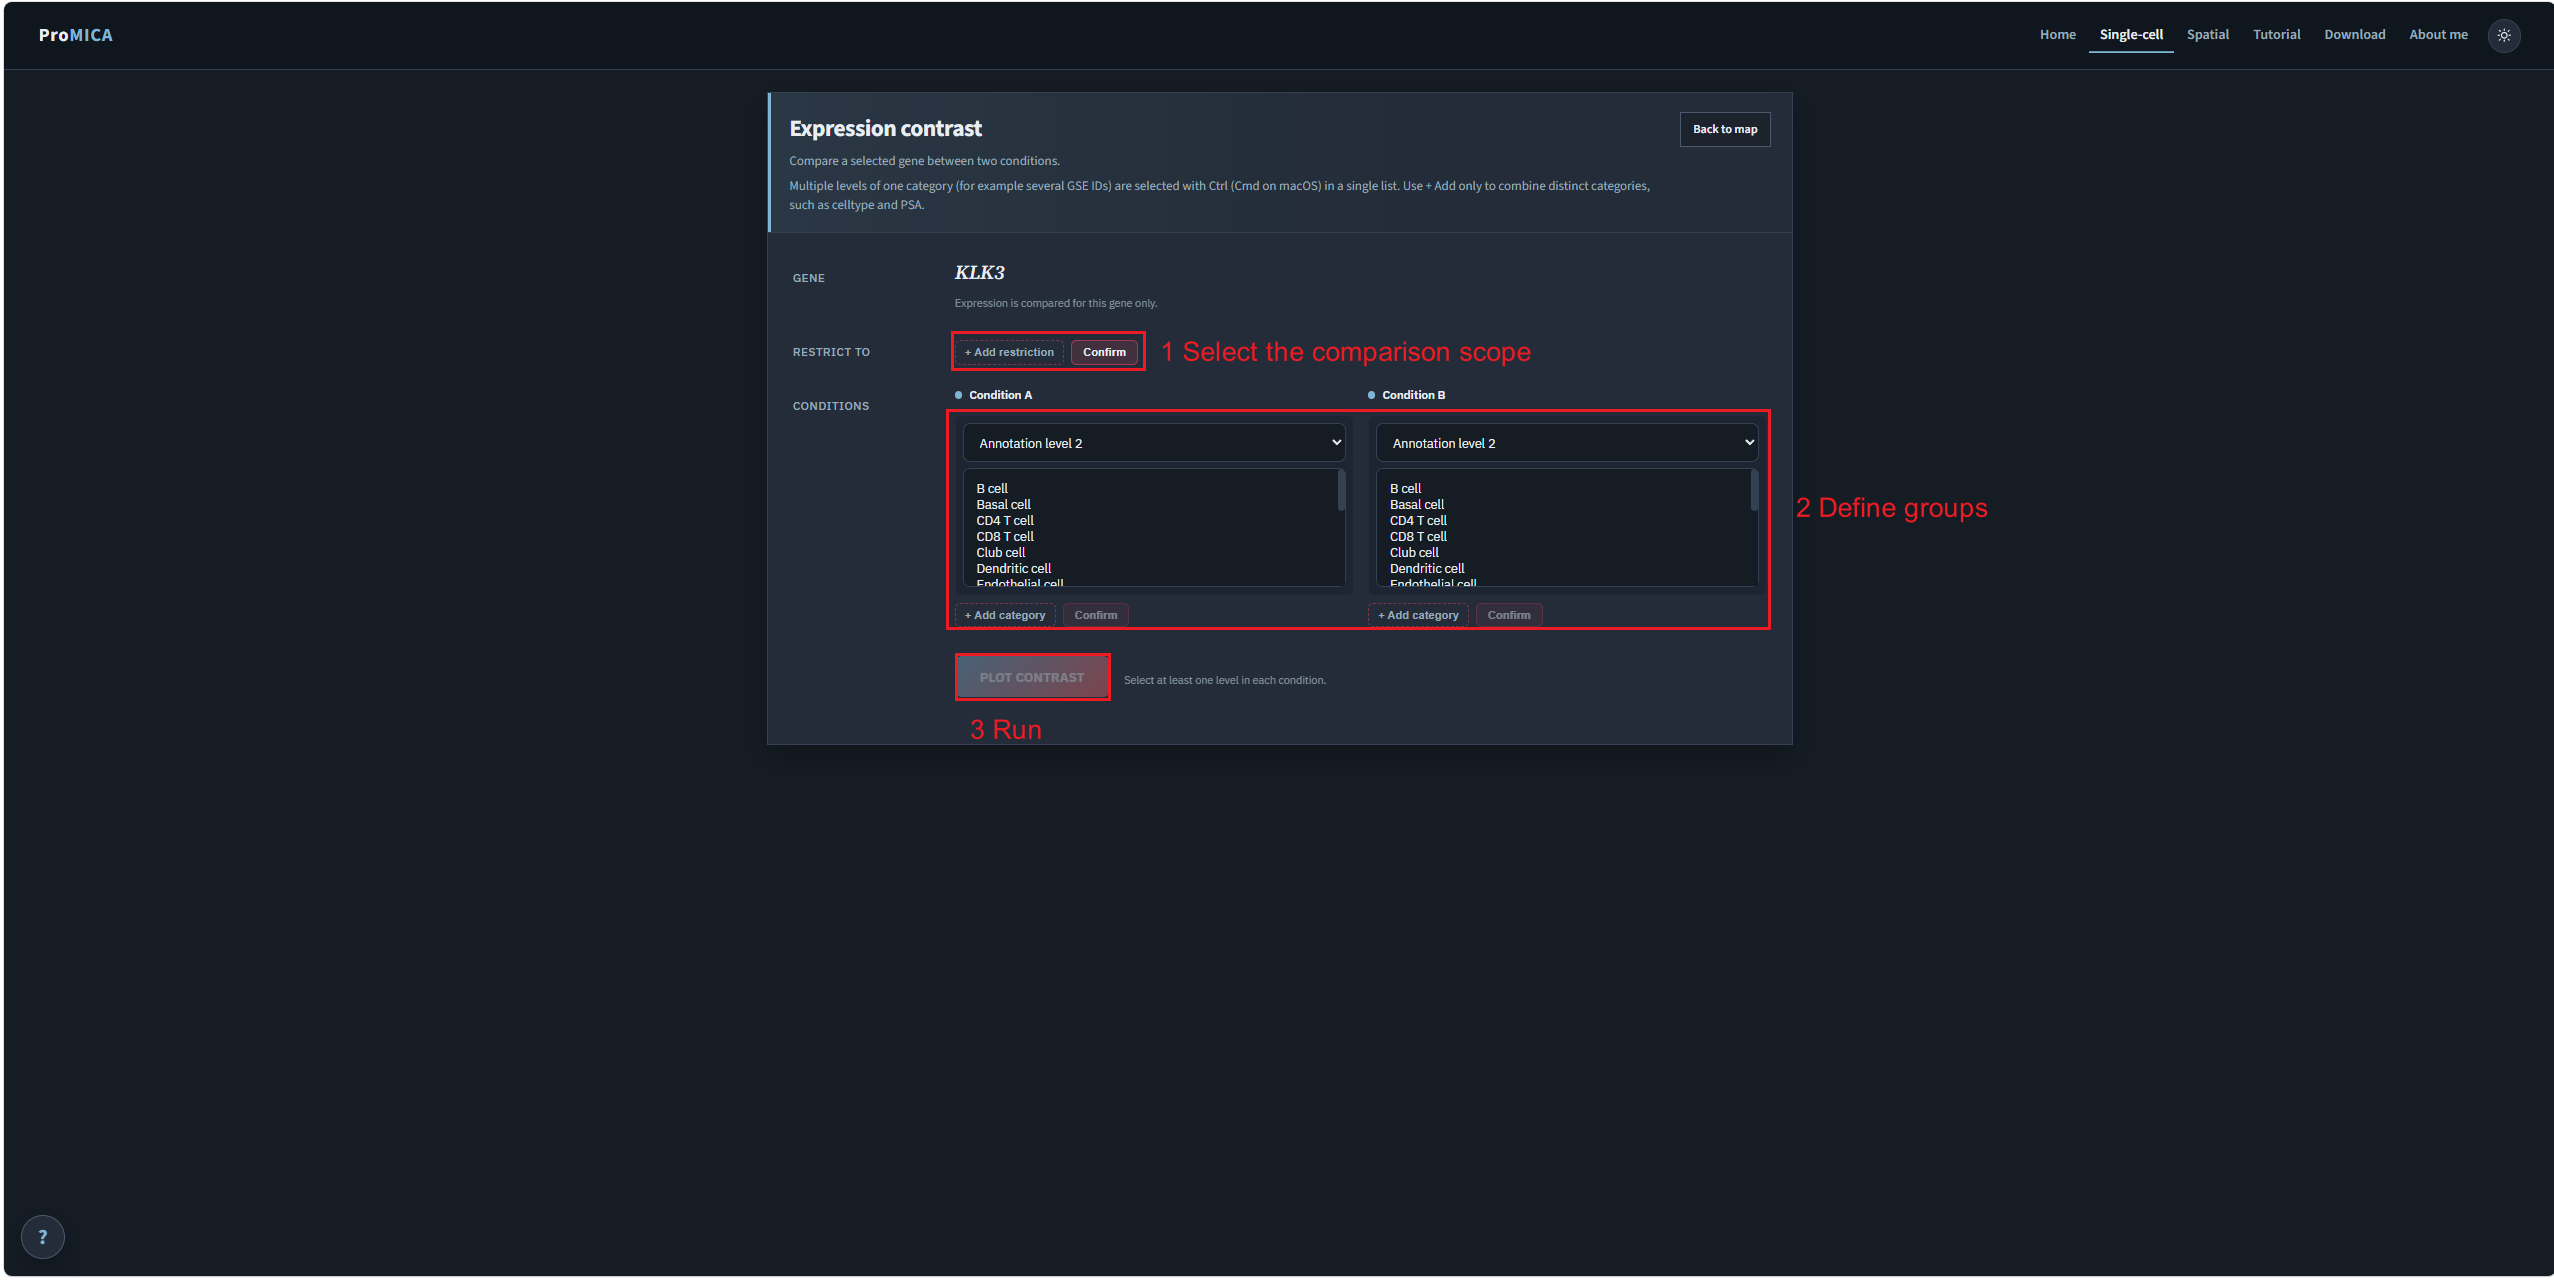
Open the Expression tab, enter a gene symbol, then continue into expression contrast when two annotated groups are to be compared.
Restrict the comparison if needed, define the two conditions from annotation categories, then plot the contrast.
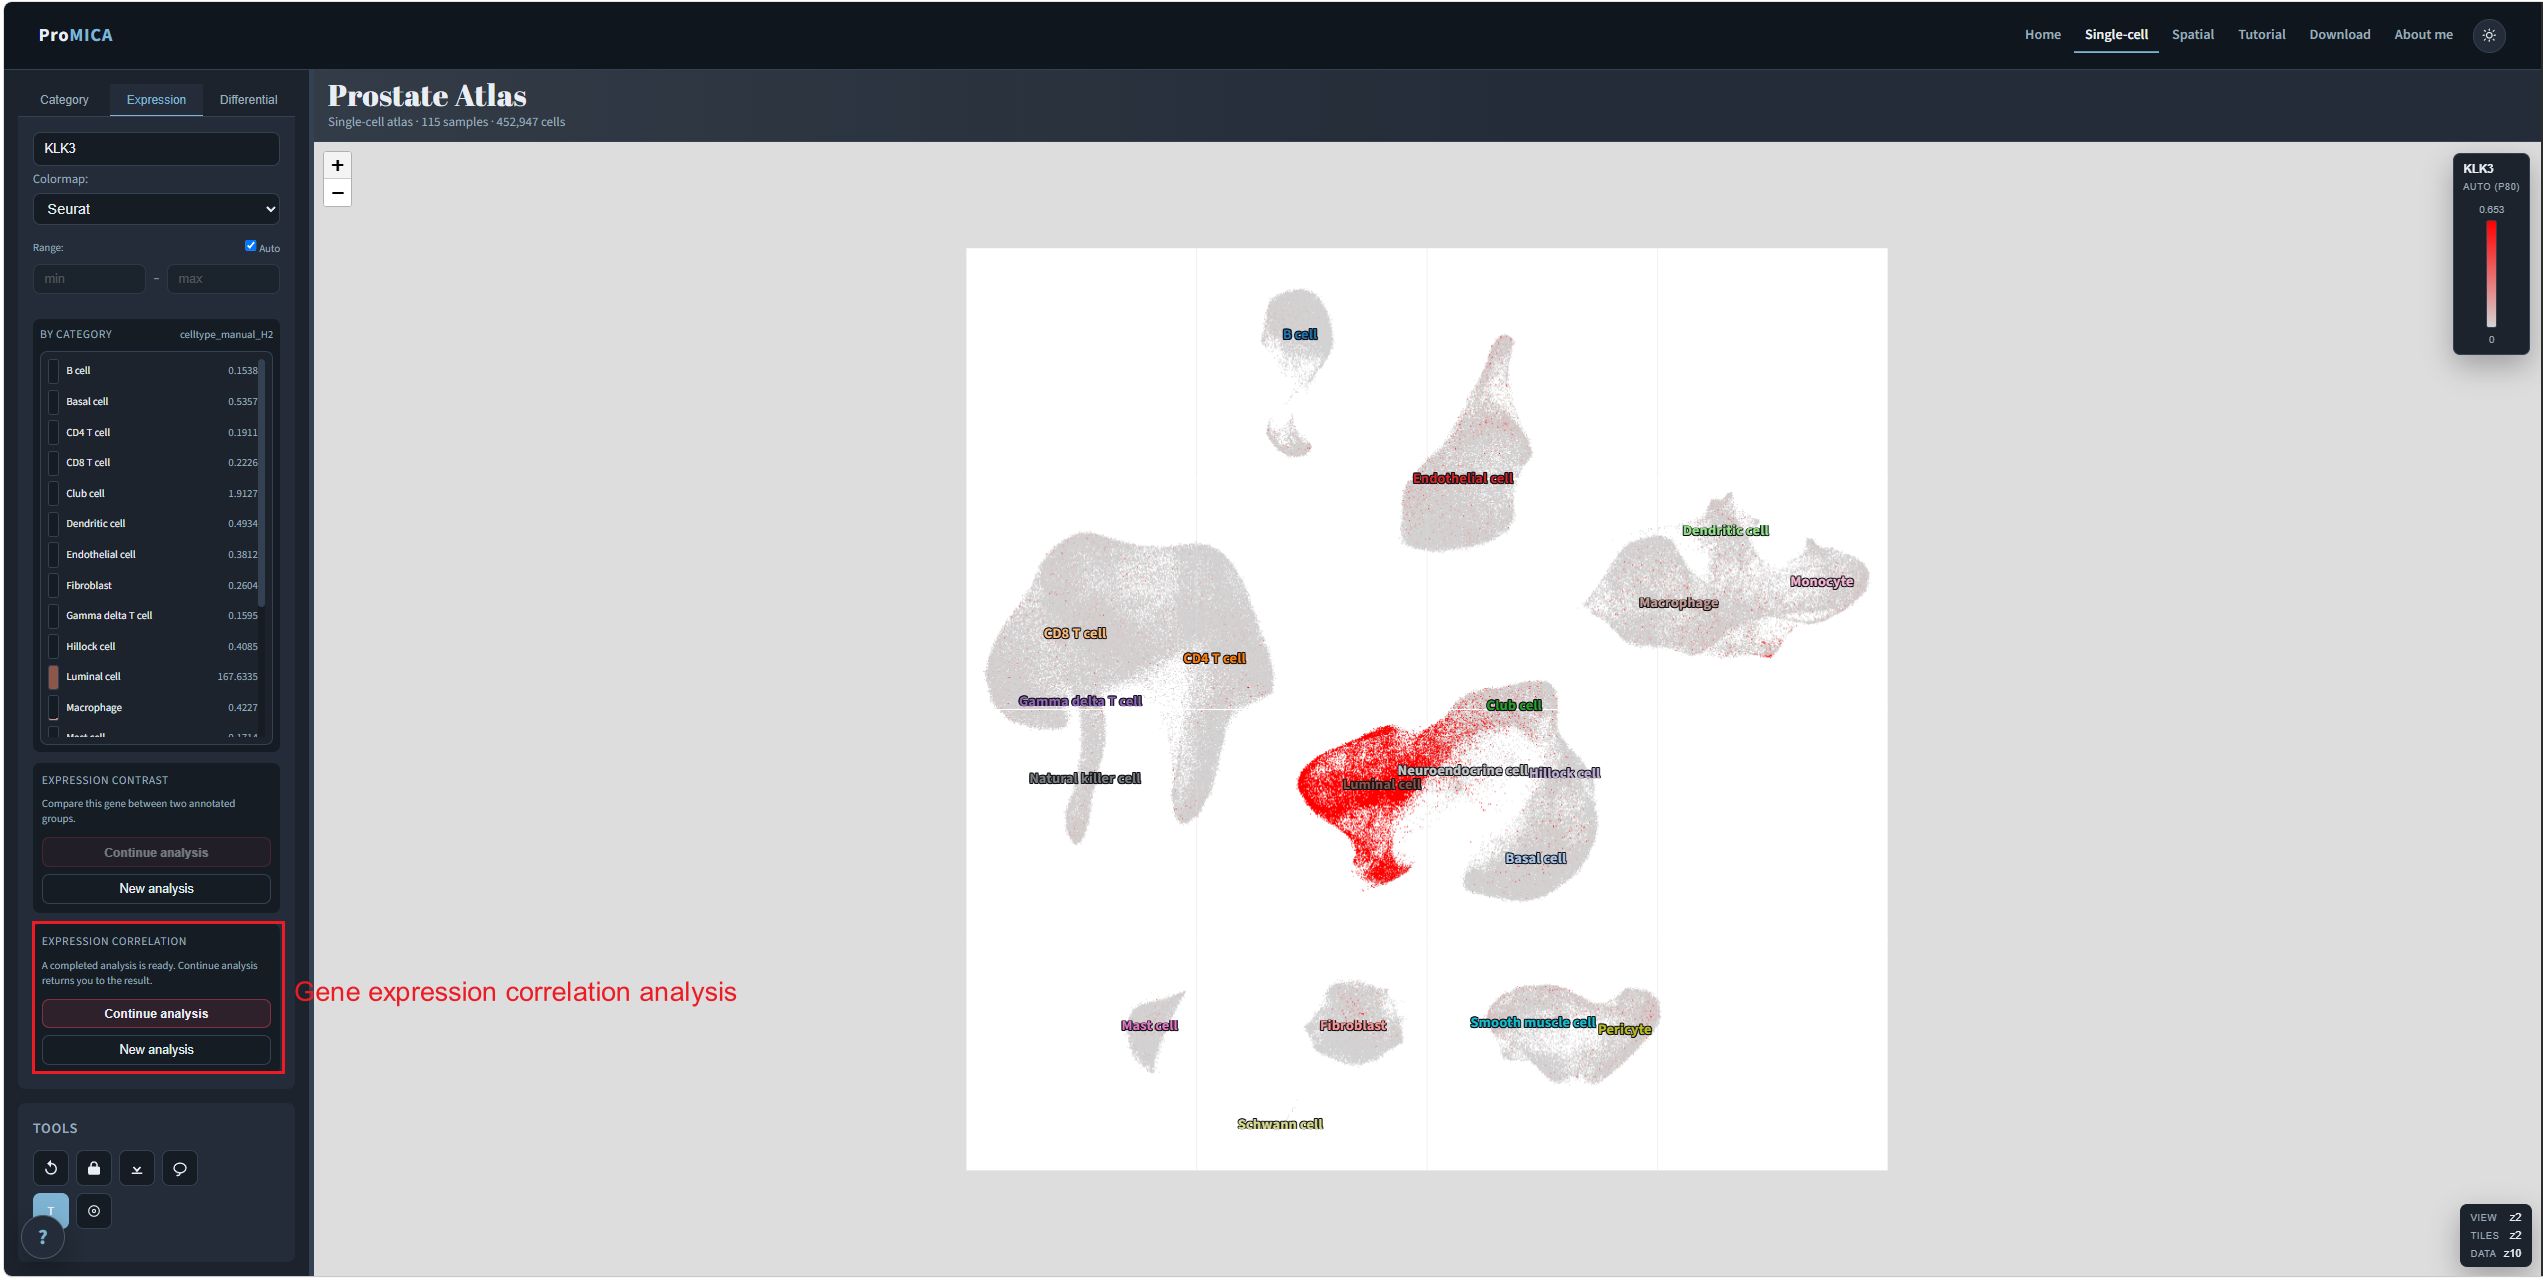
From the Expression tab, continue into correlation analysis to pair the plotted gene with a second gene.
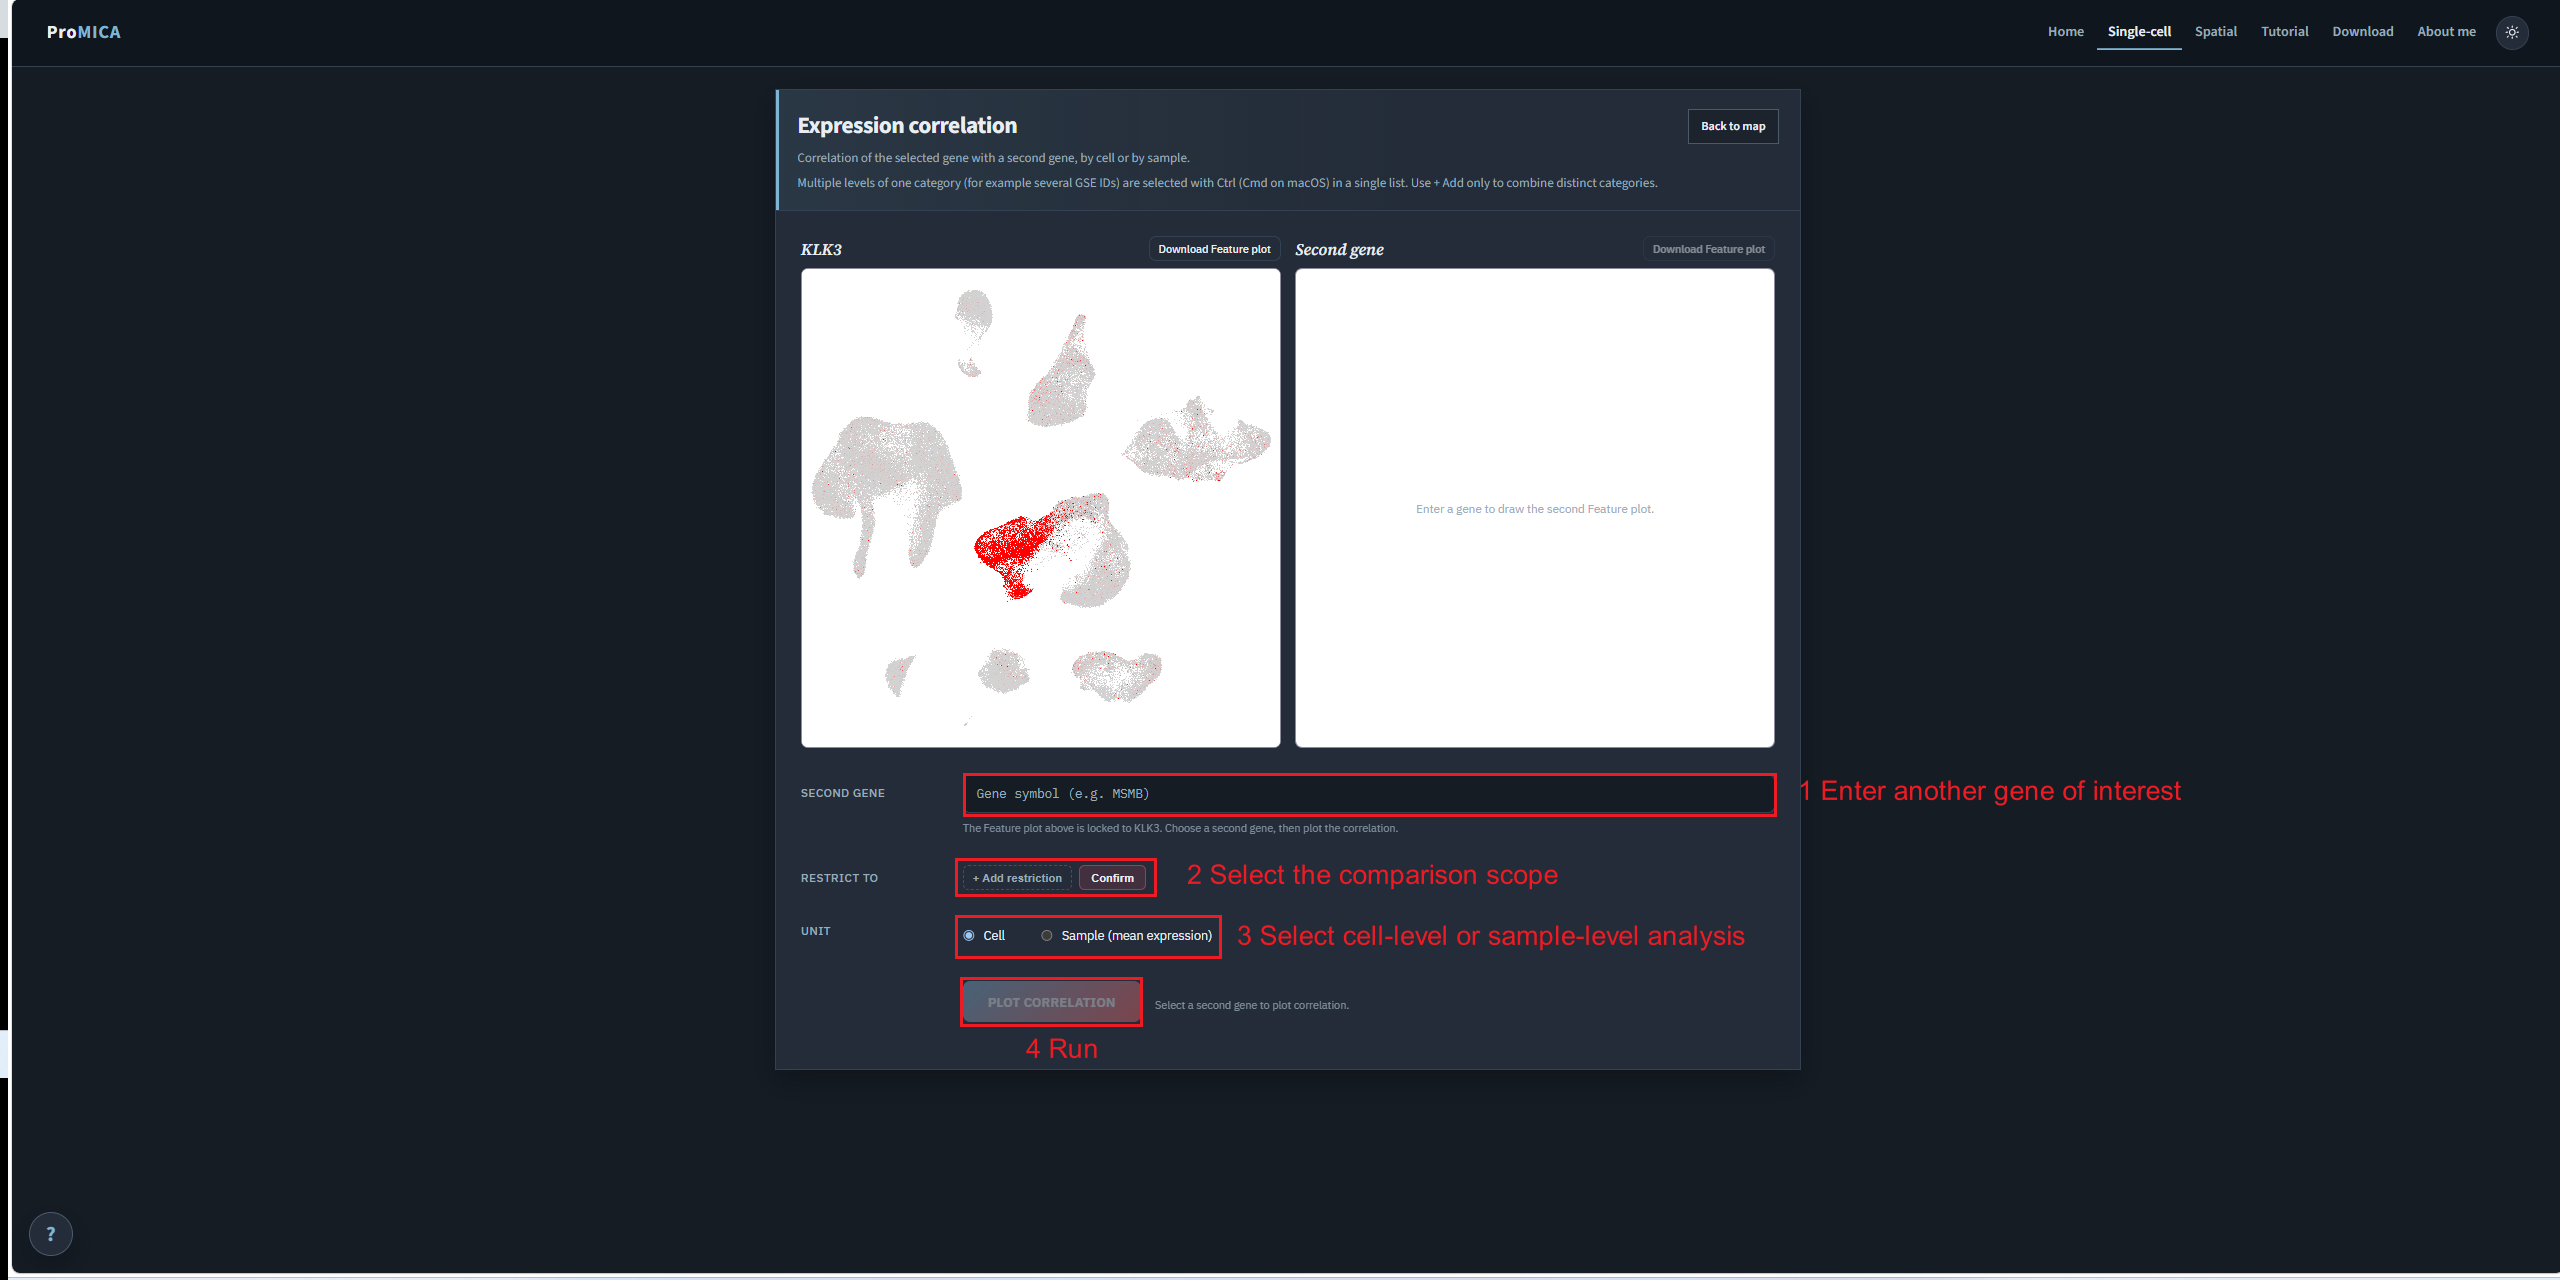
Enter the second gene, optionally restrict the cohort, choose cell- or sample-level units, then plot the correlation.
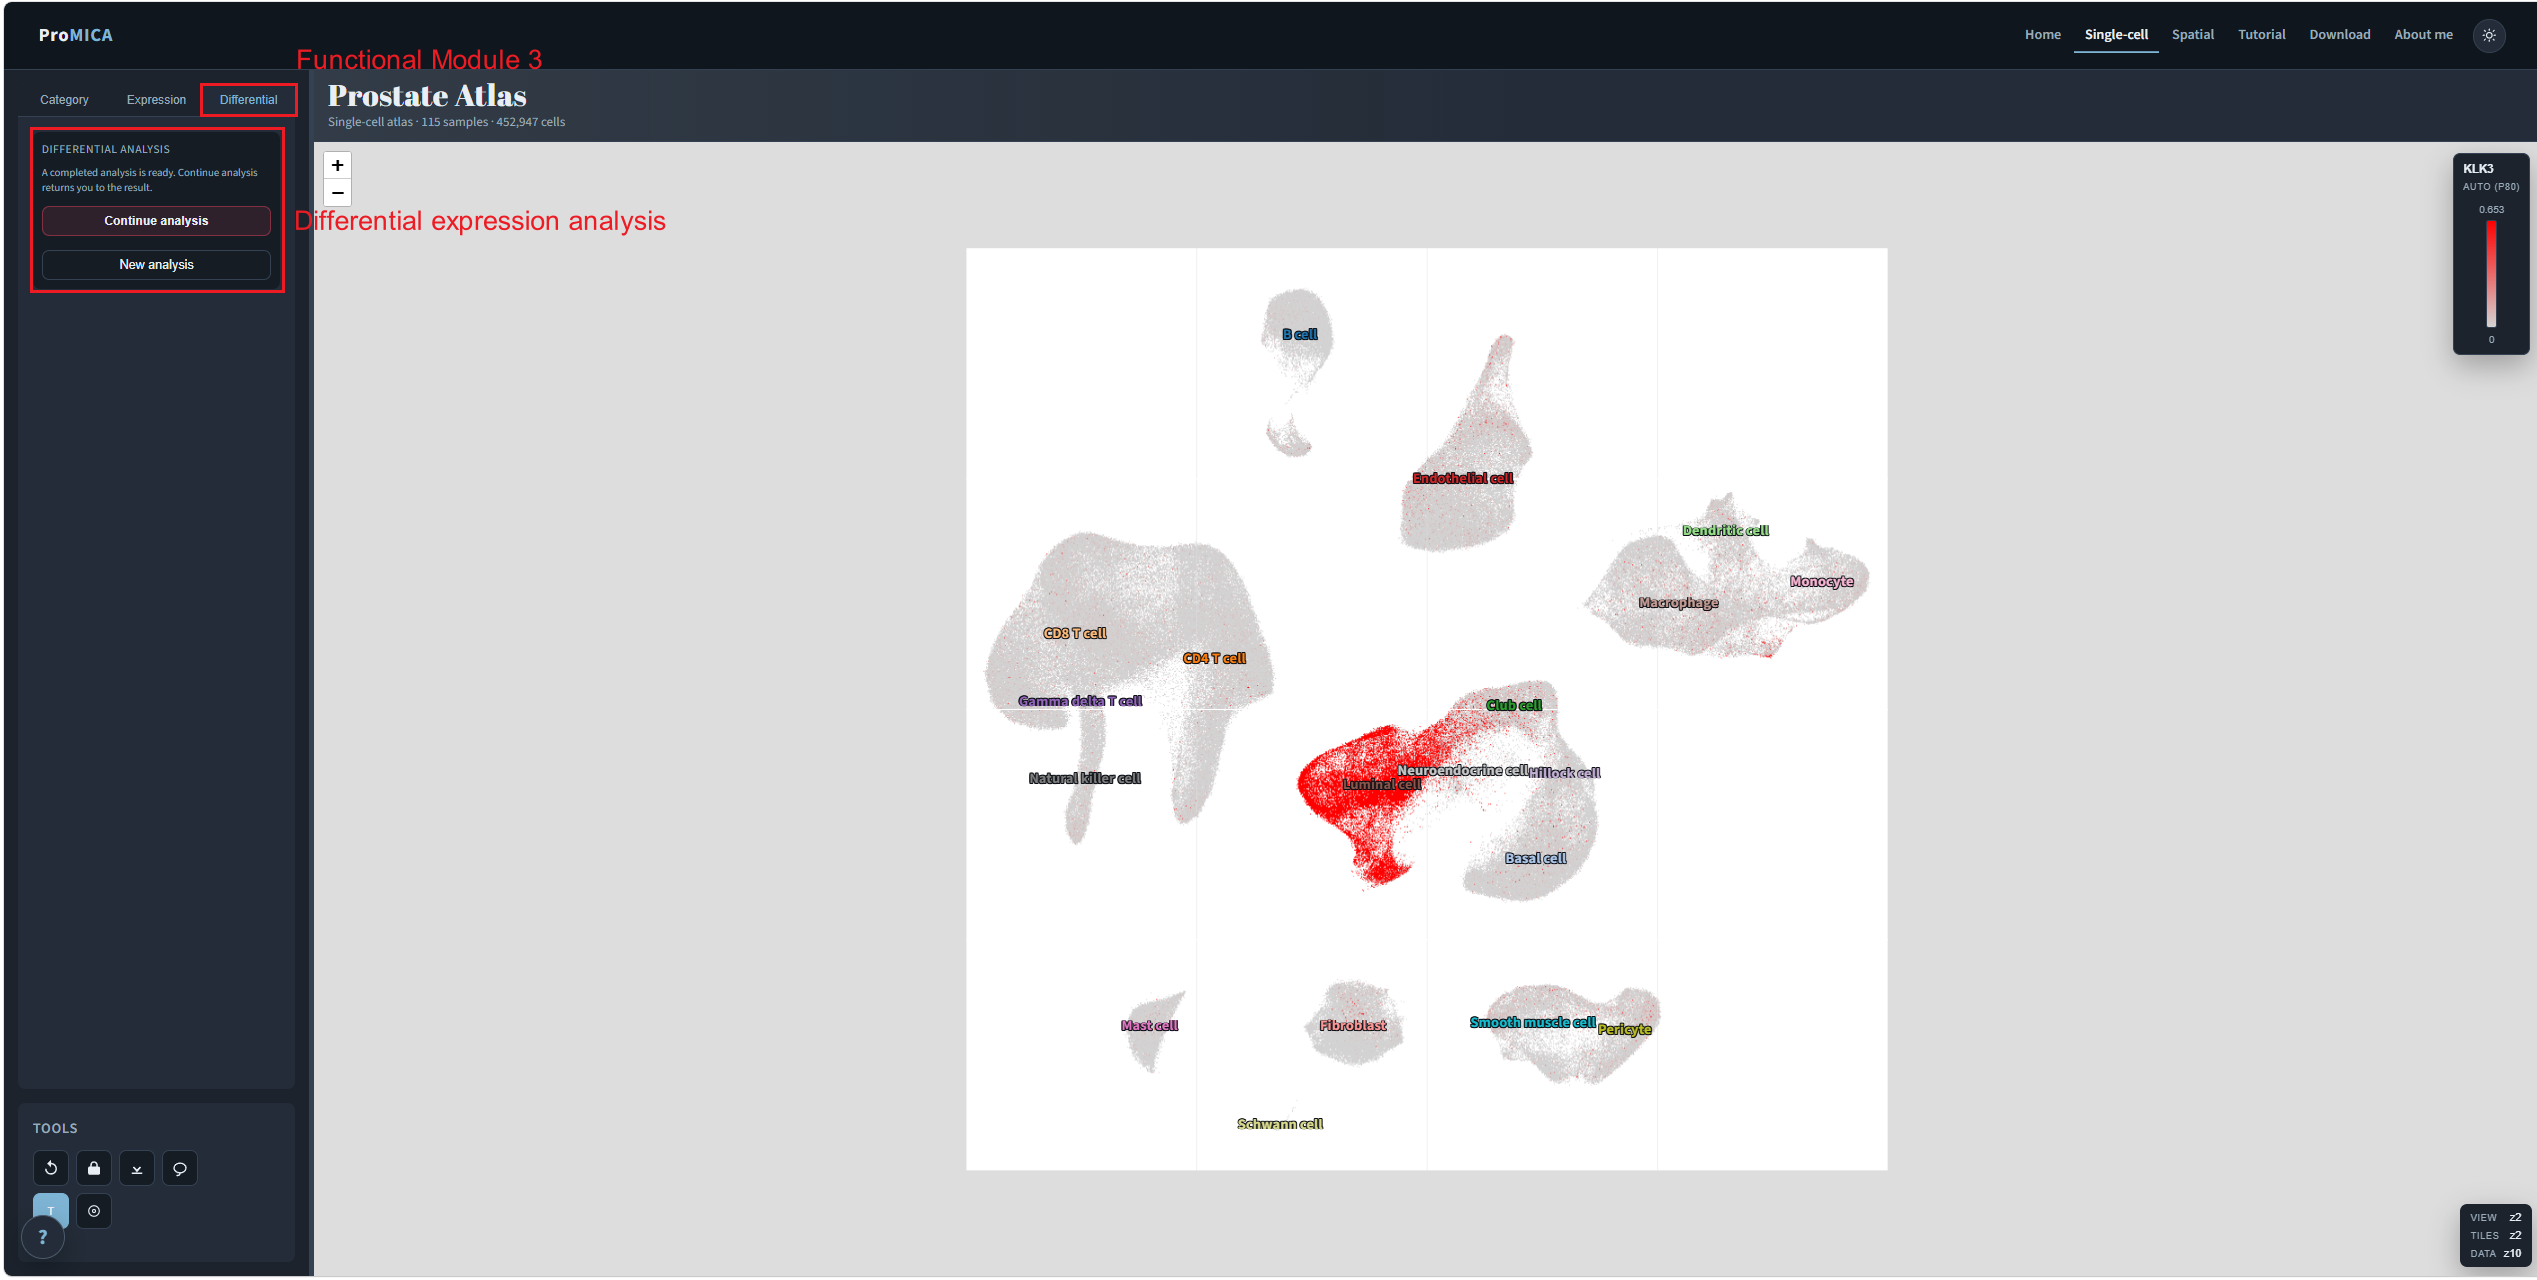
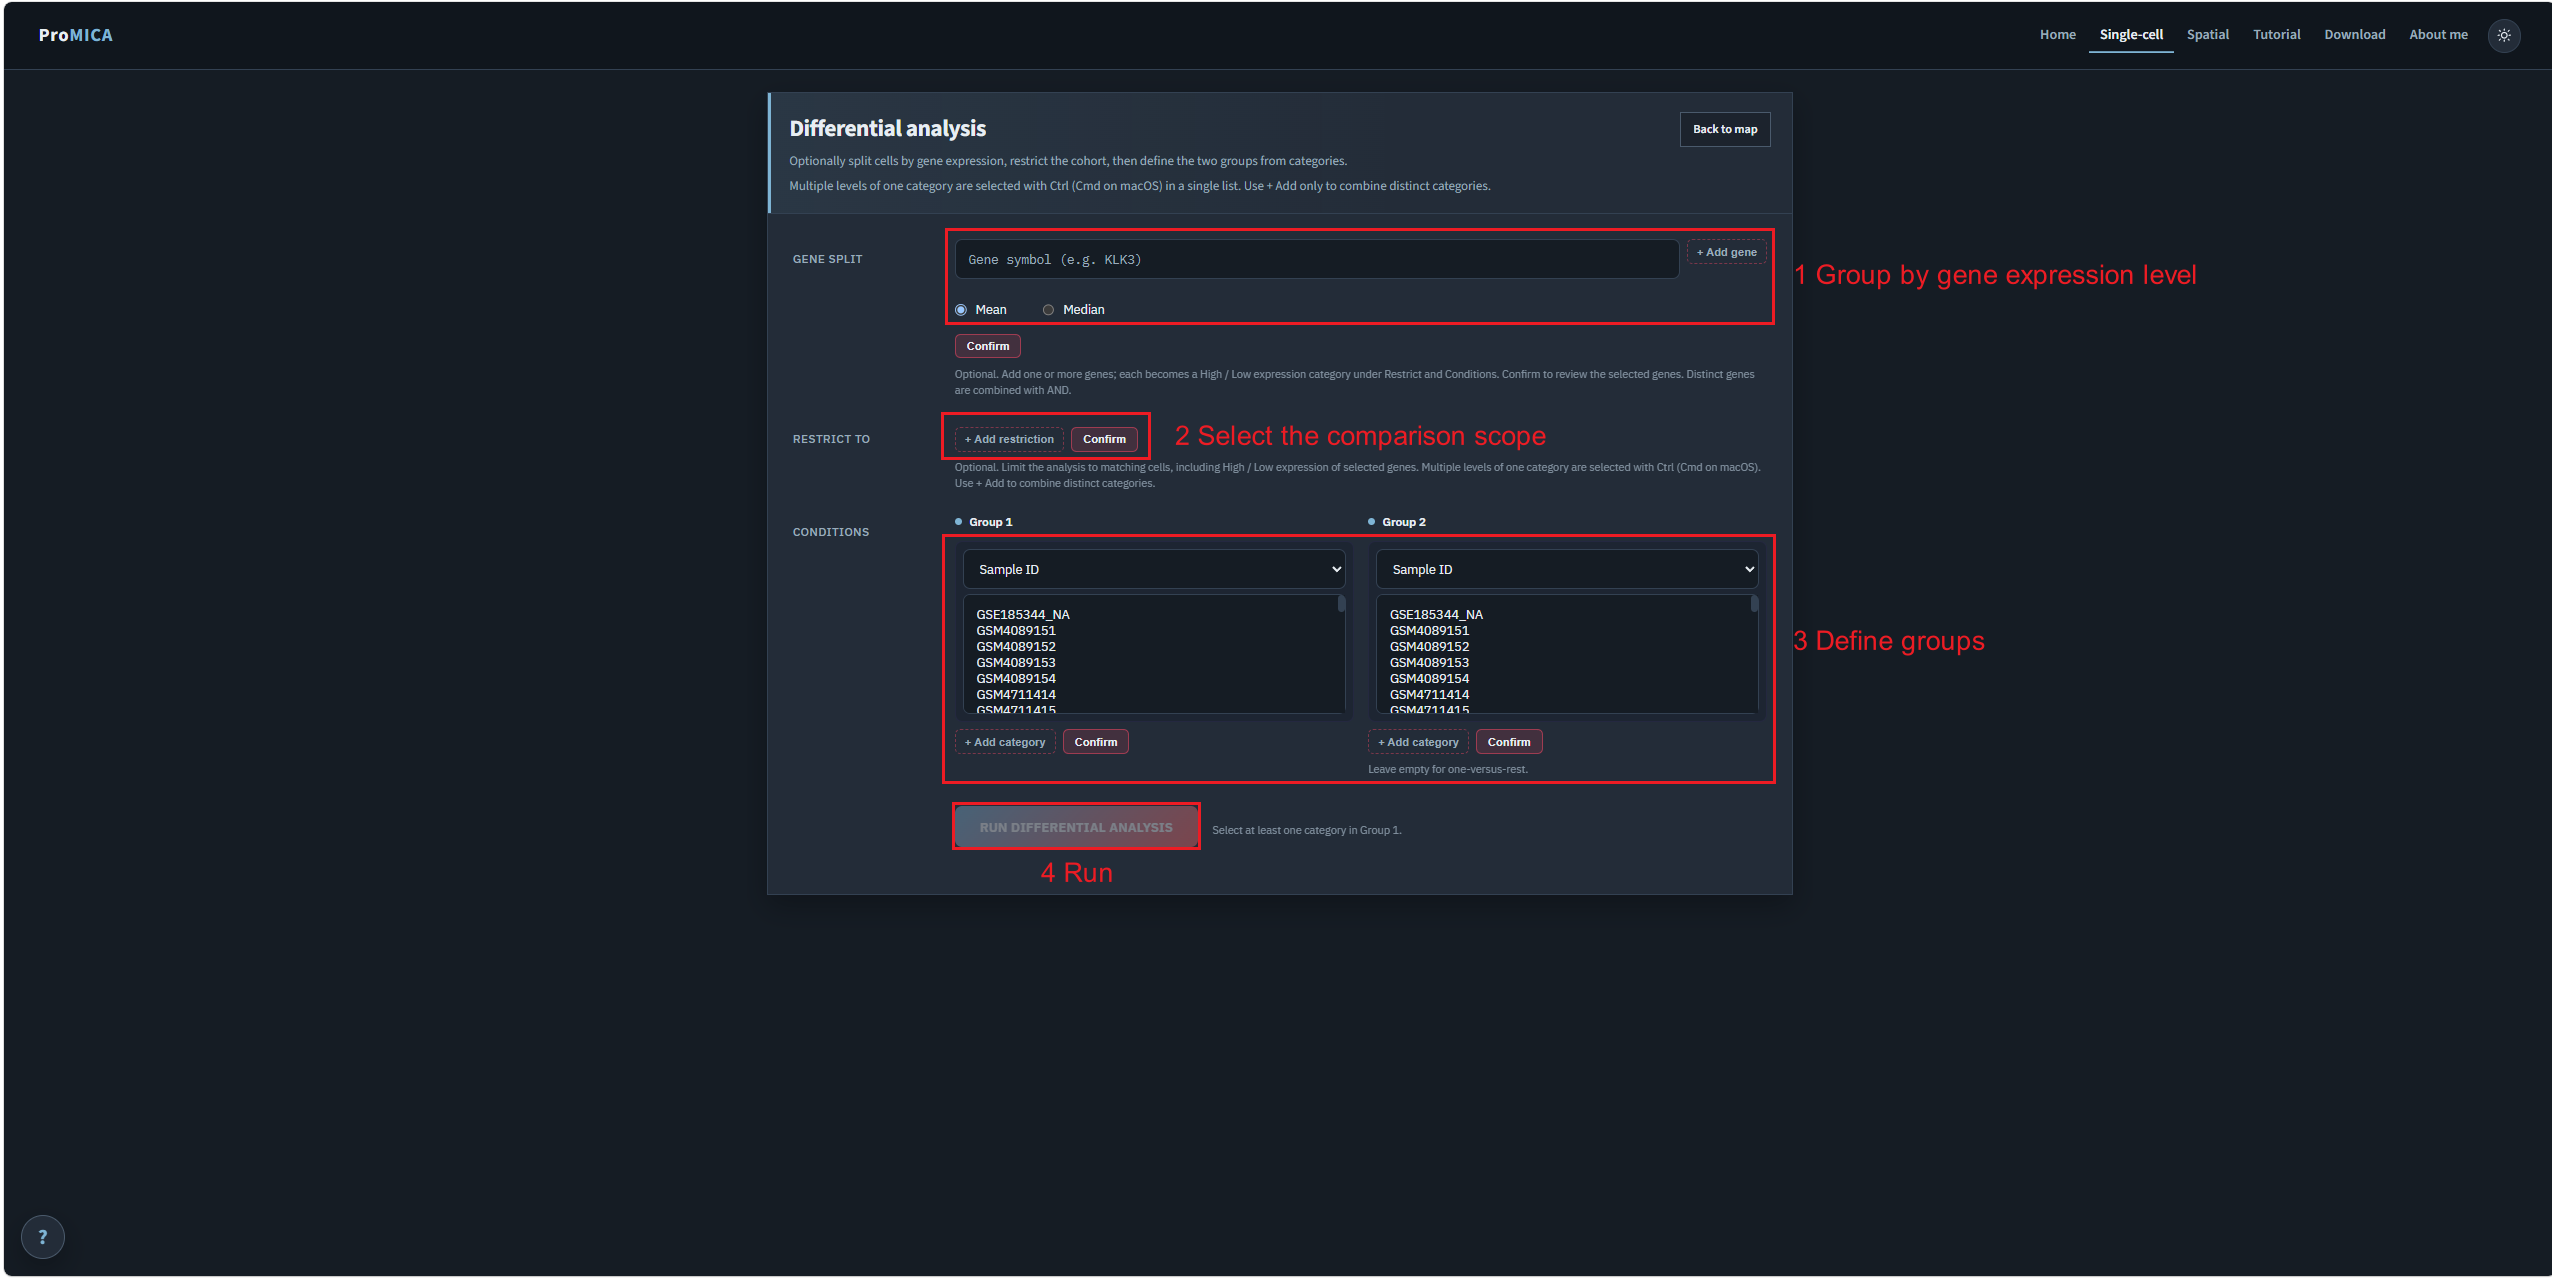
Compare two groups of cells and rank genes by differential expression, with optional pathway enrichment on the ranked list.
Optionally split cells by gene expression, restrict the cohort, assign categories to Group 1 and Group 2, then run the test.
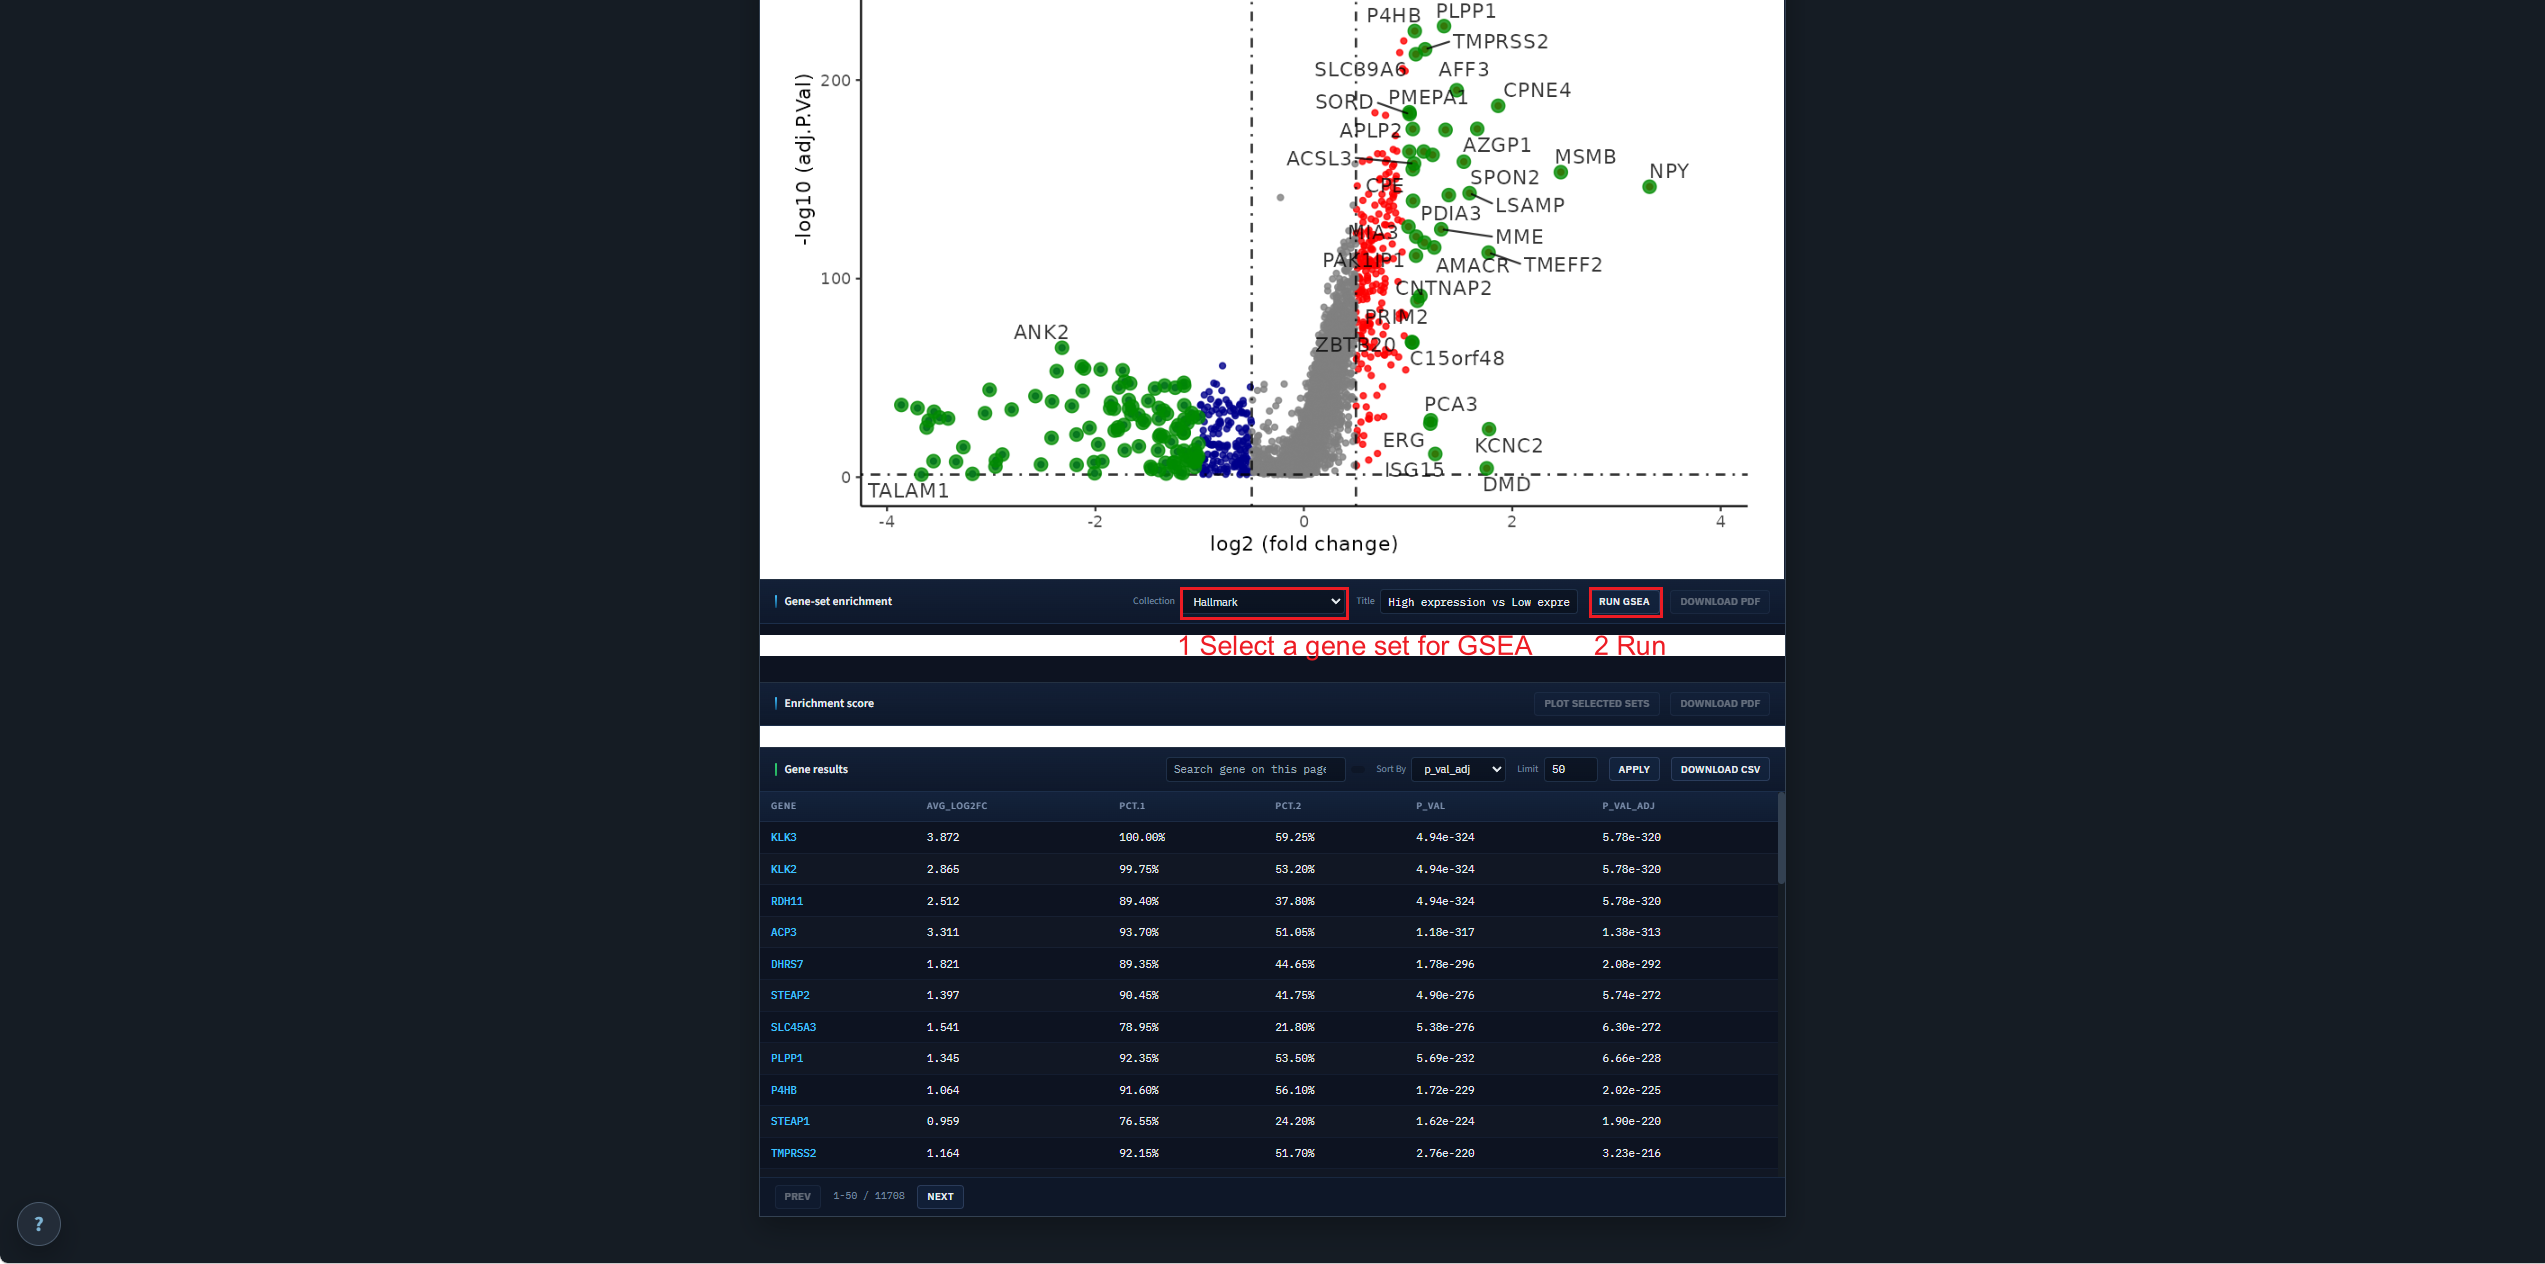
On the result page, choose a gene-set collection and run GSEA on the ranked contrast.
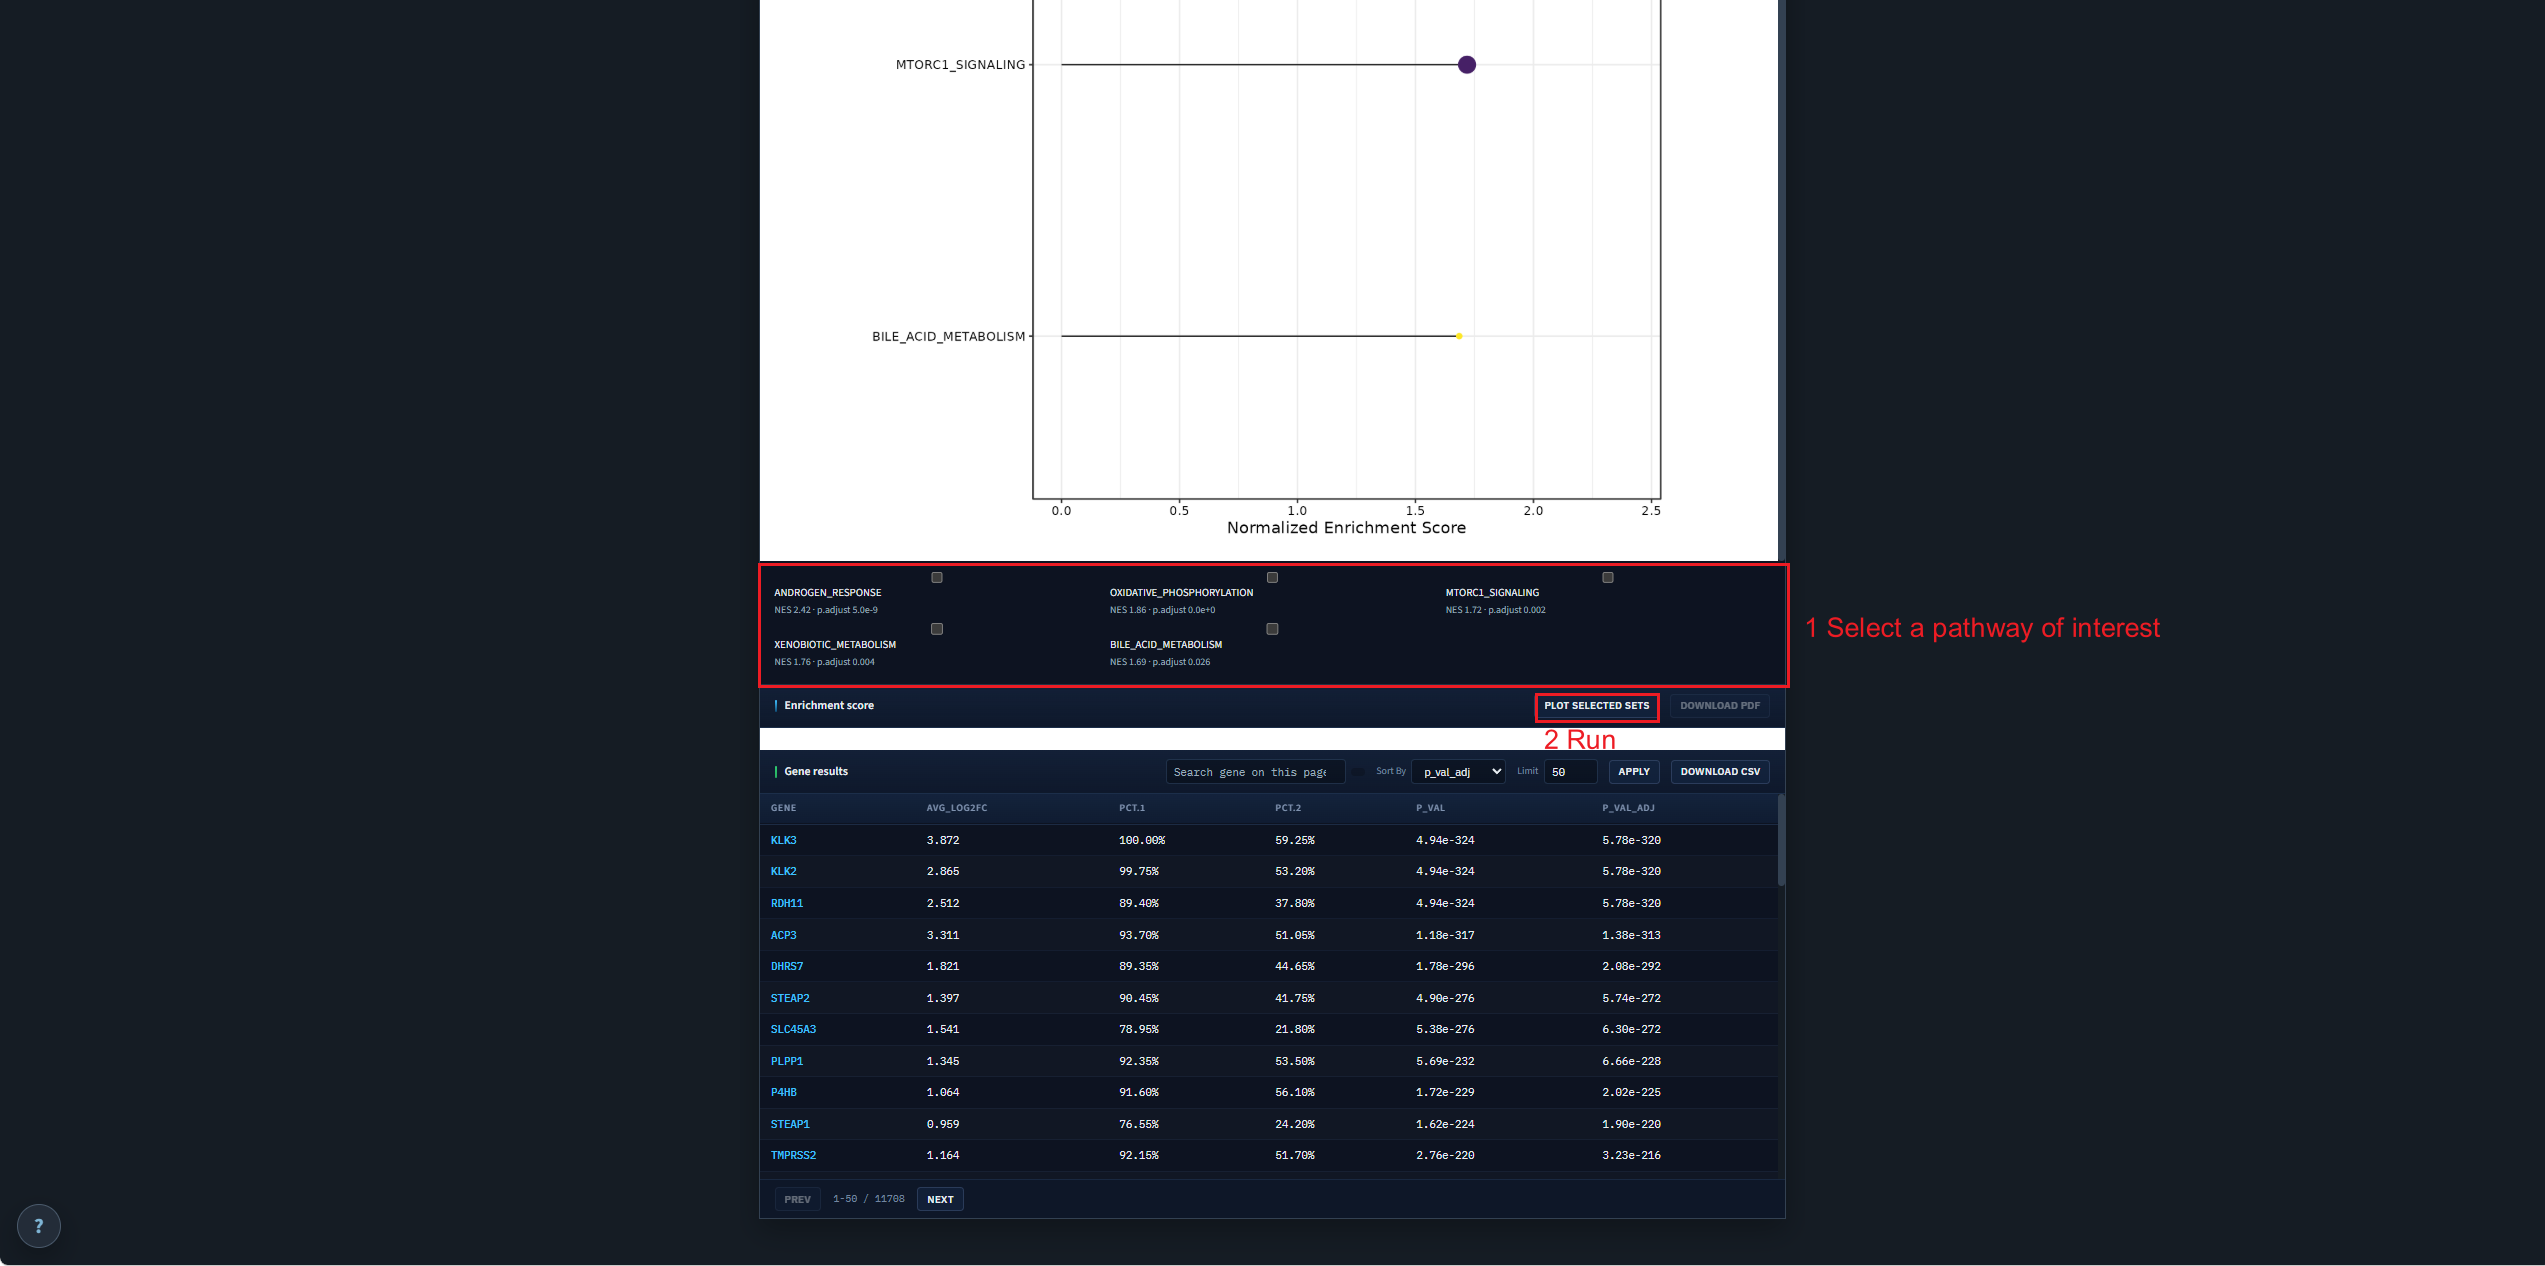
Select one or more enriched sets and plot the running-score curves.
Walkthrough 02
Map cell-type annotation or gene expression on a pathology section, then run expression contrast or spatial colocalization.
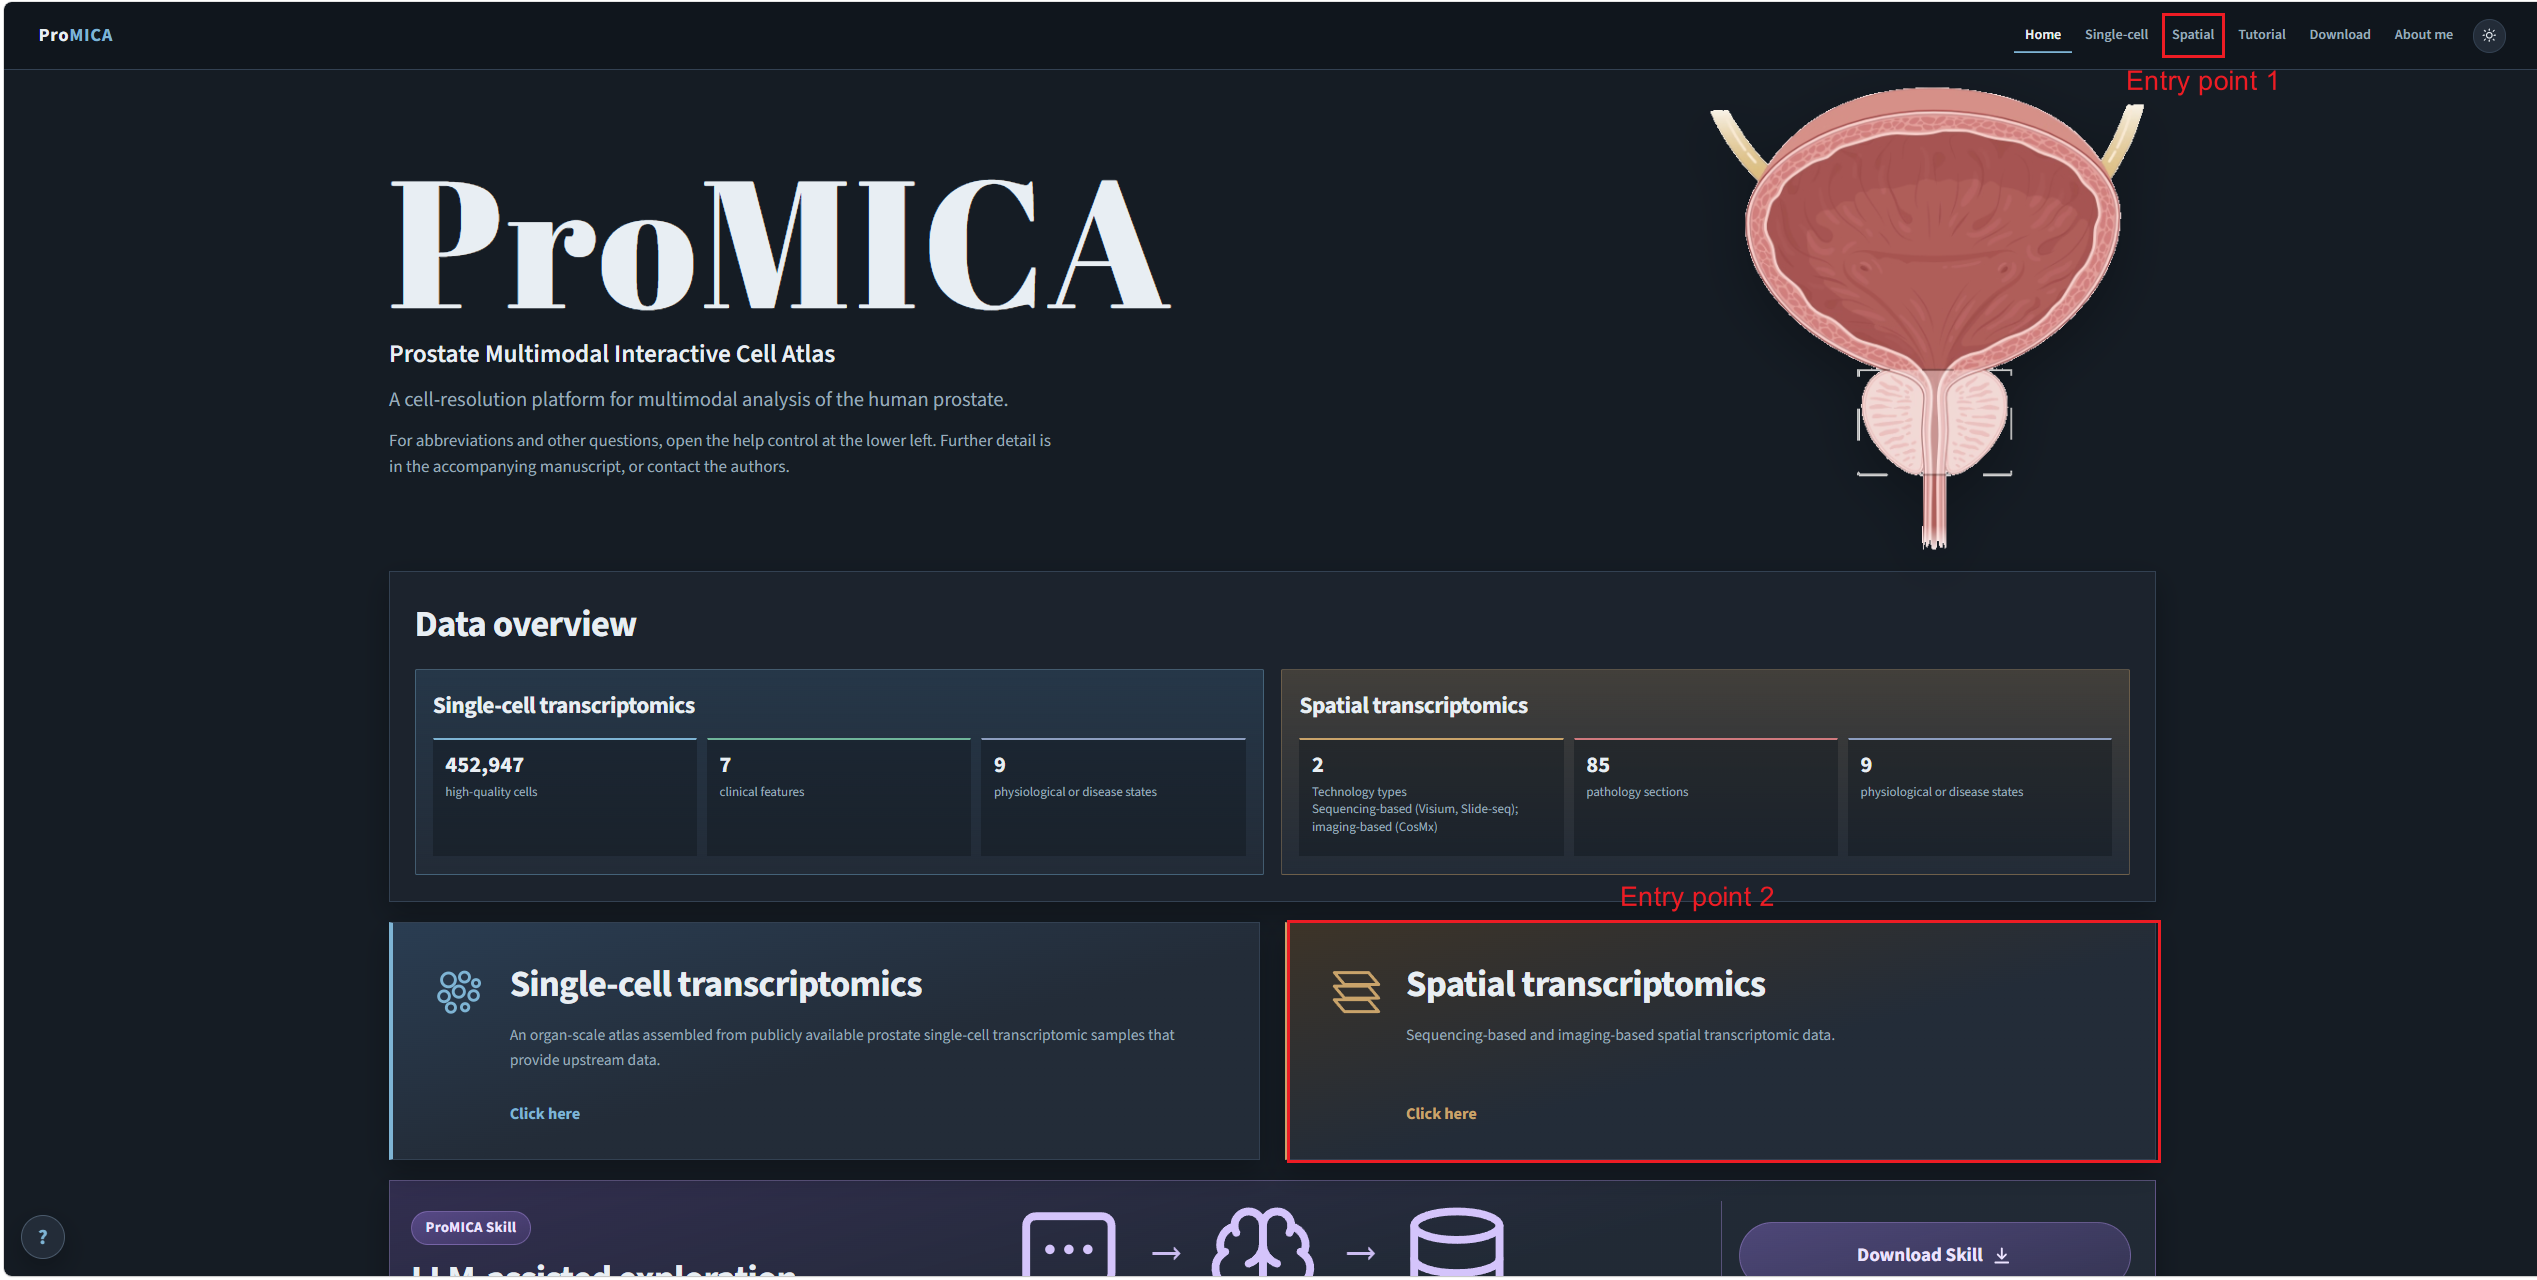
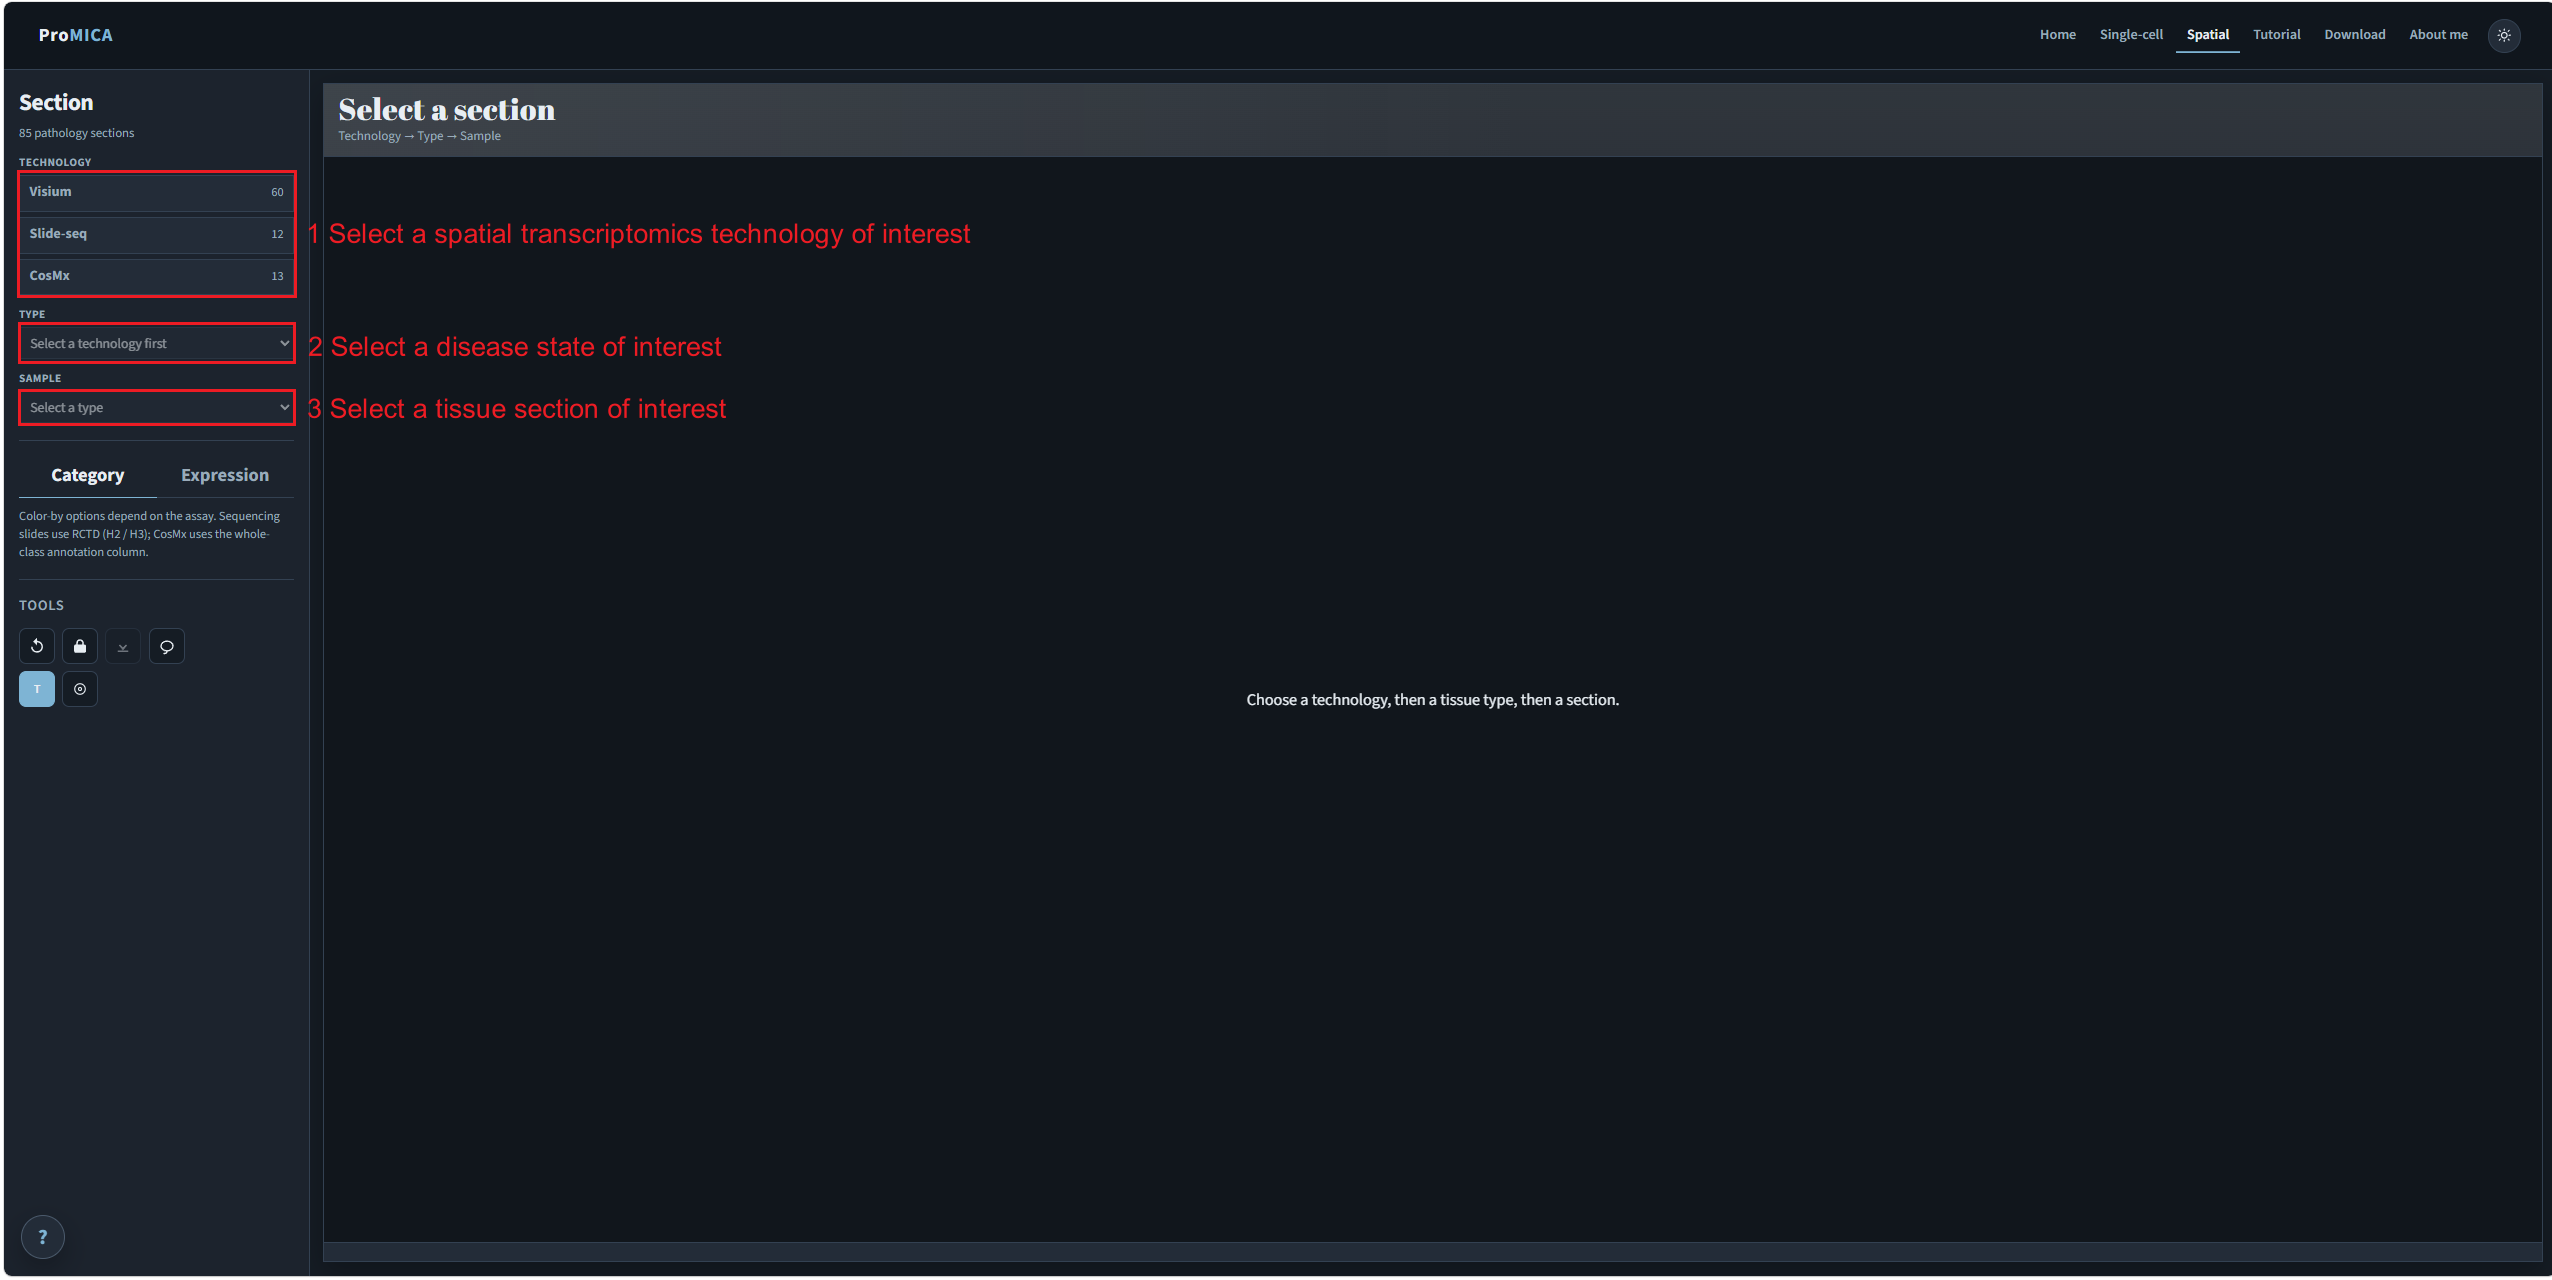
Use Spatial in the top navigation, or the Spatial transcriptomics card on the home page.
Specify the spatial transcriptomic assay, the physiological or disease state, and the pathology section, in that order.
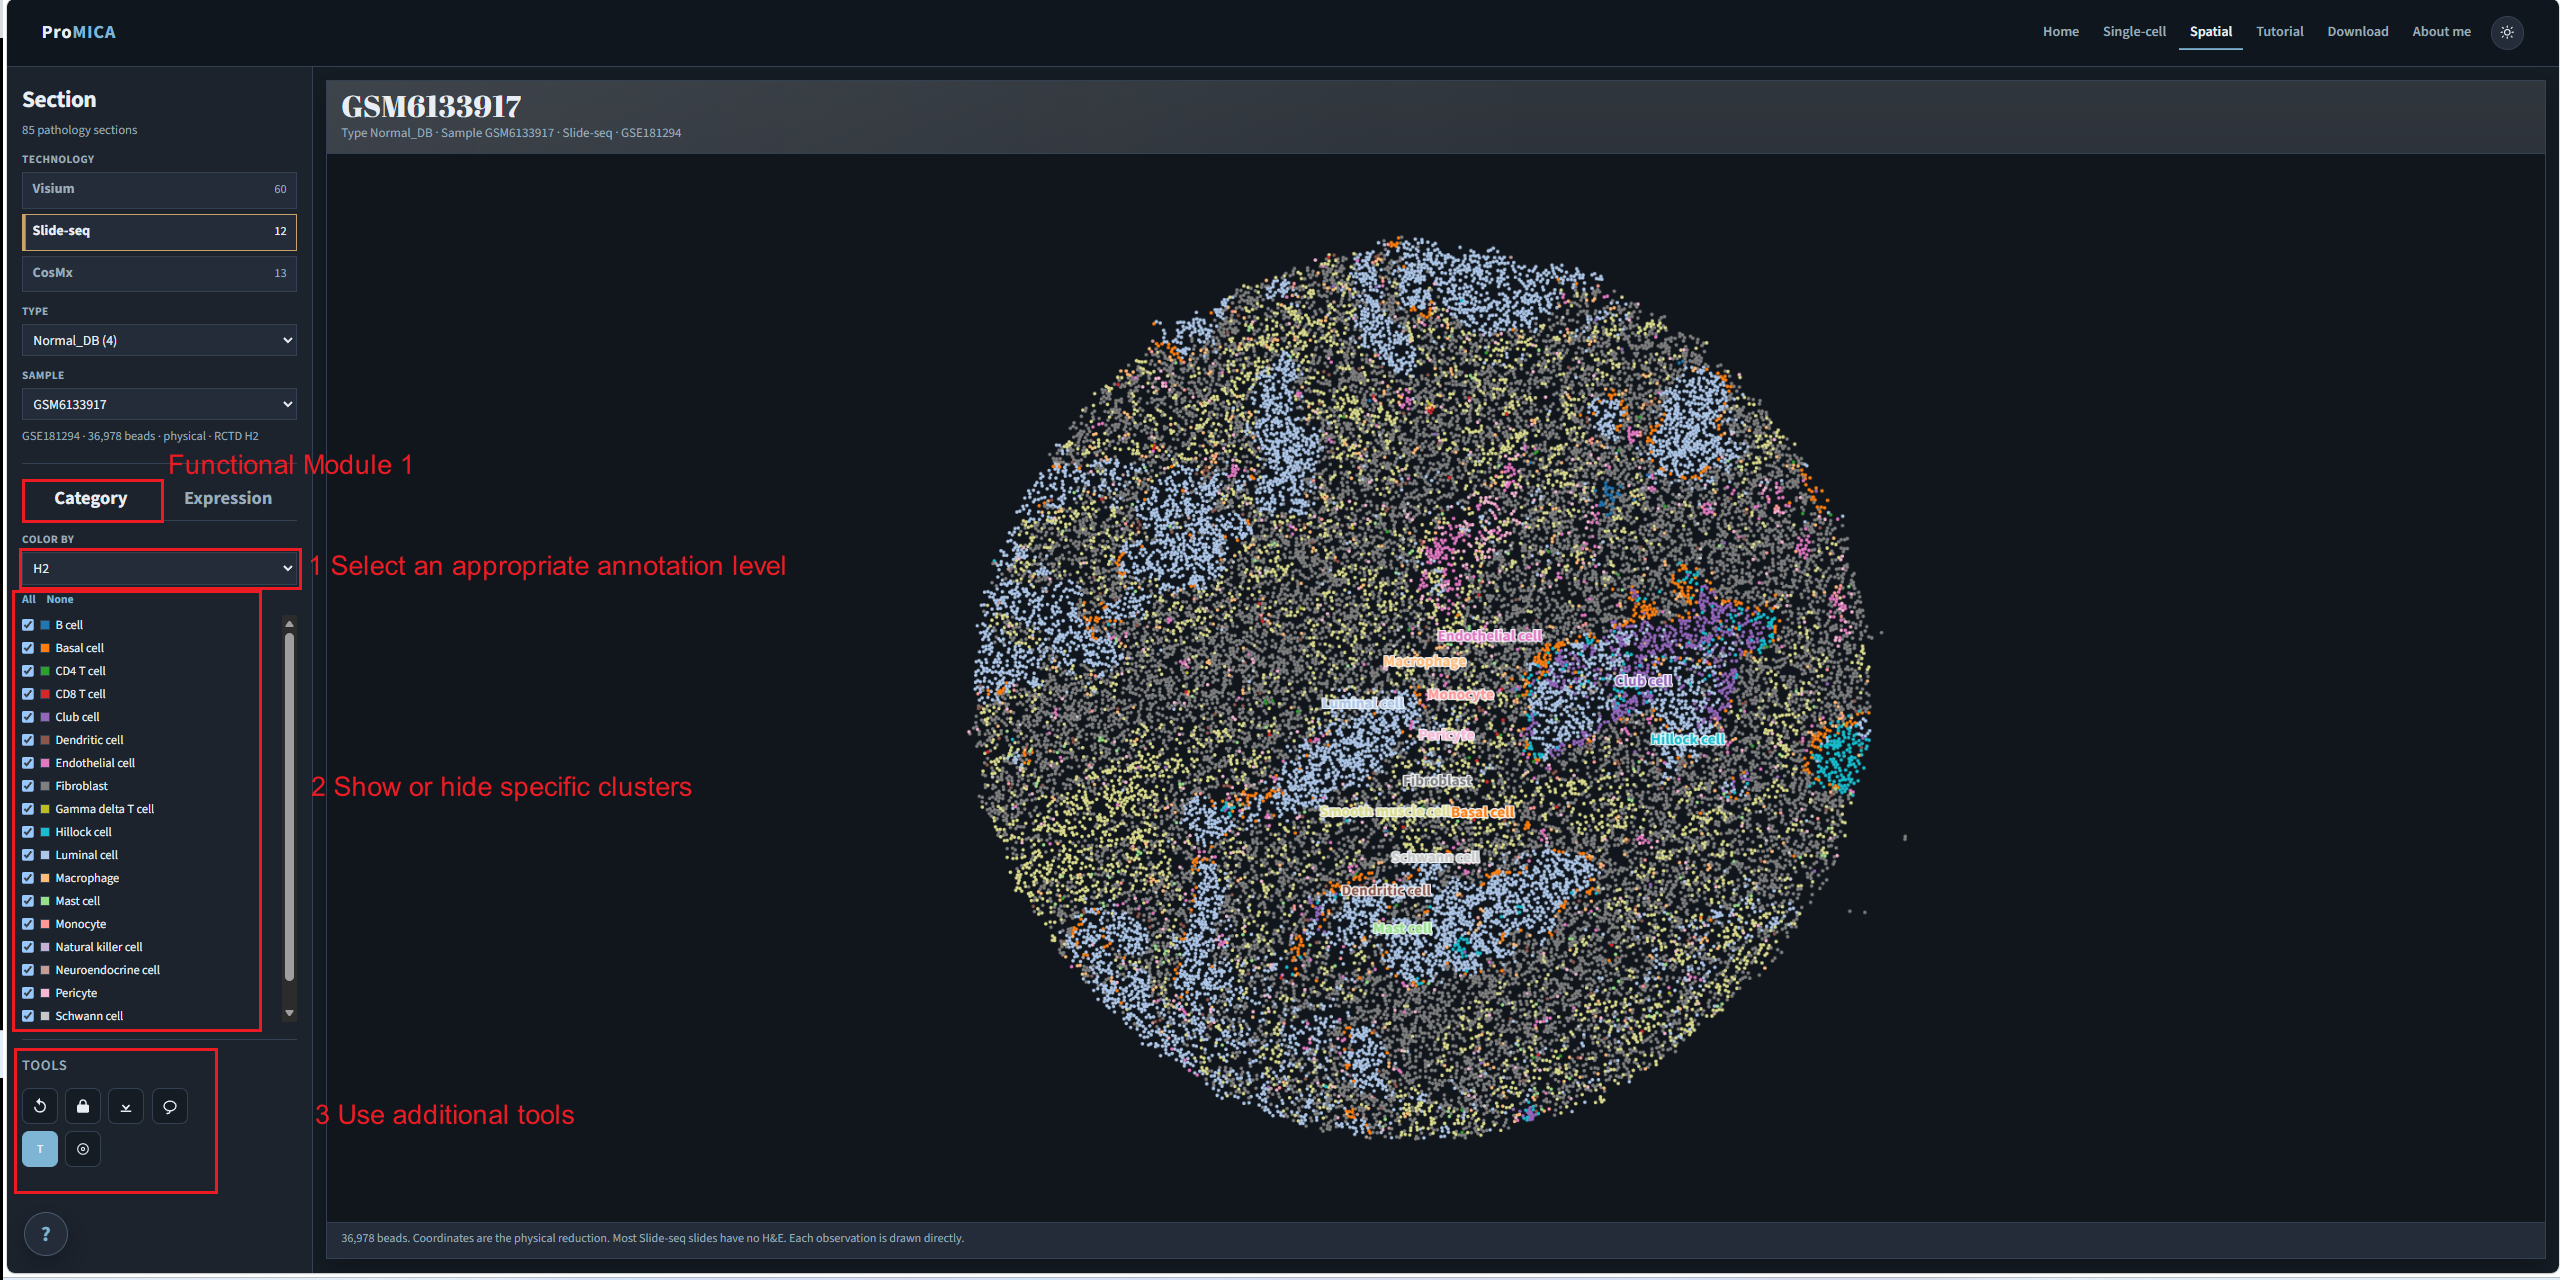
Select the annotation layer, show or hide cell types, and use the map tools as needed.
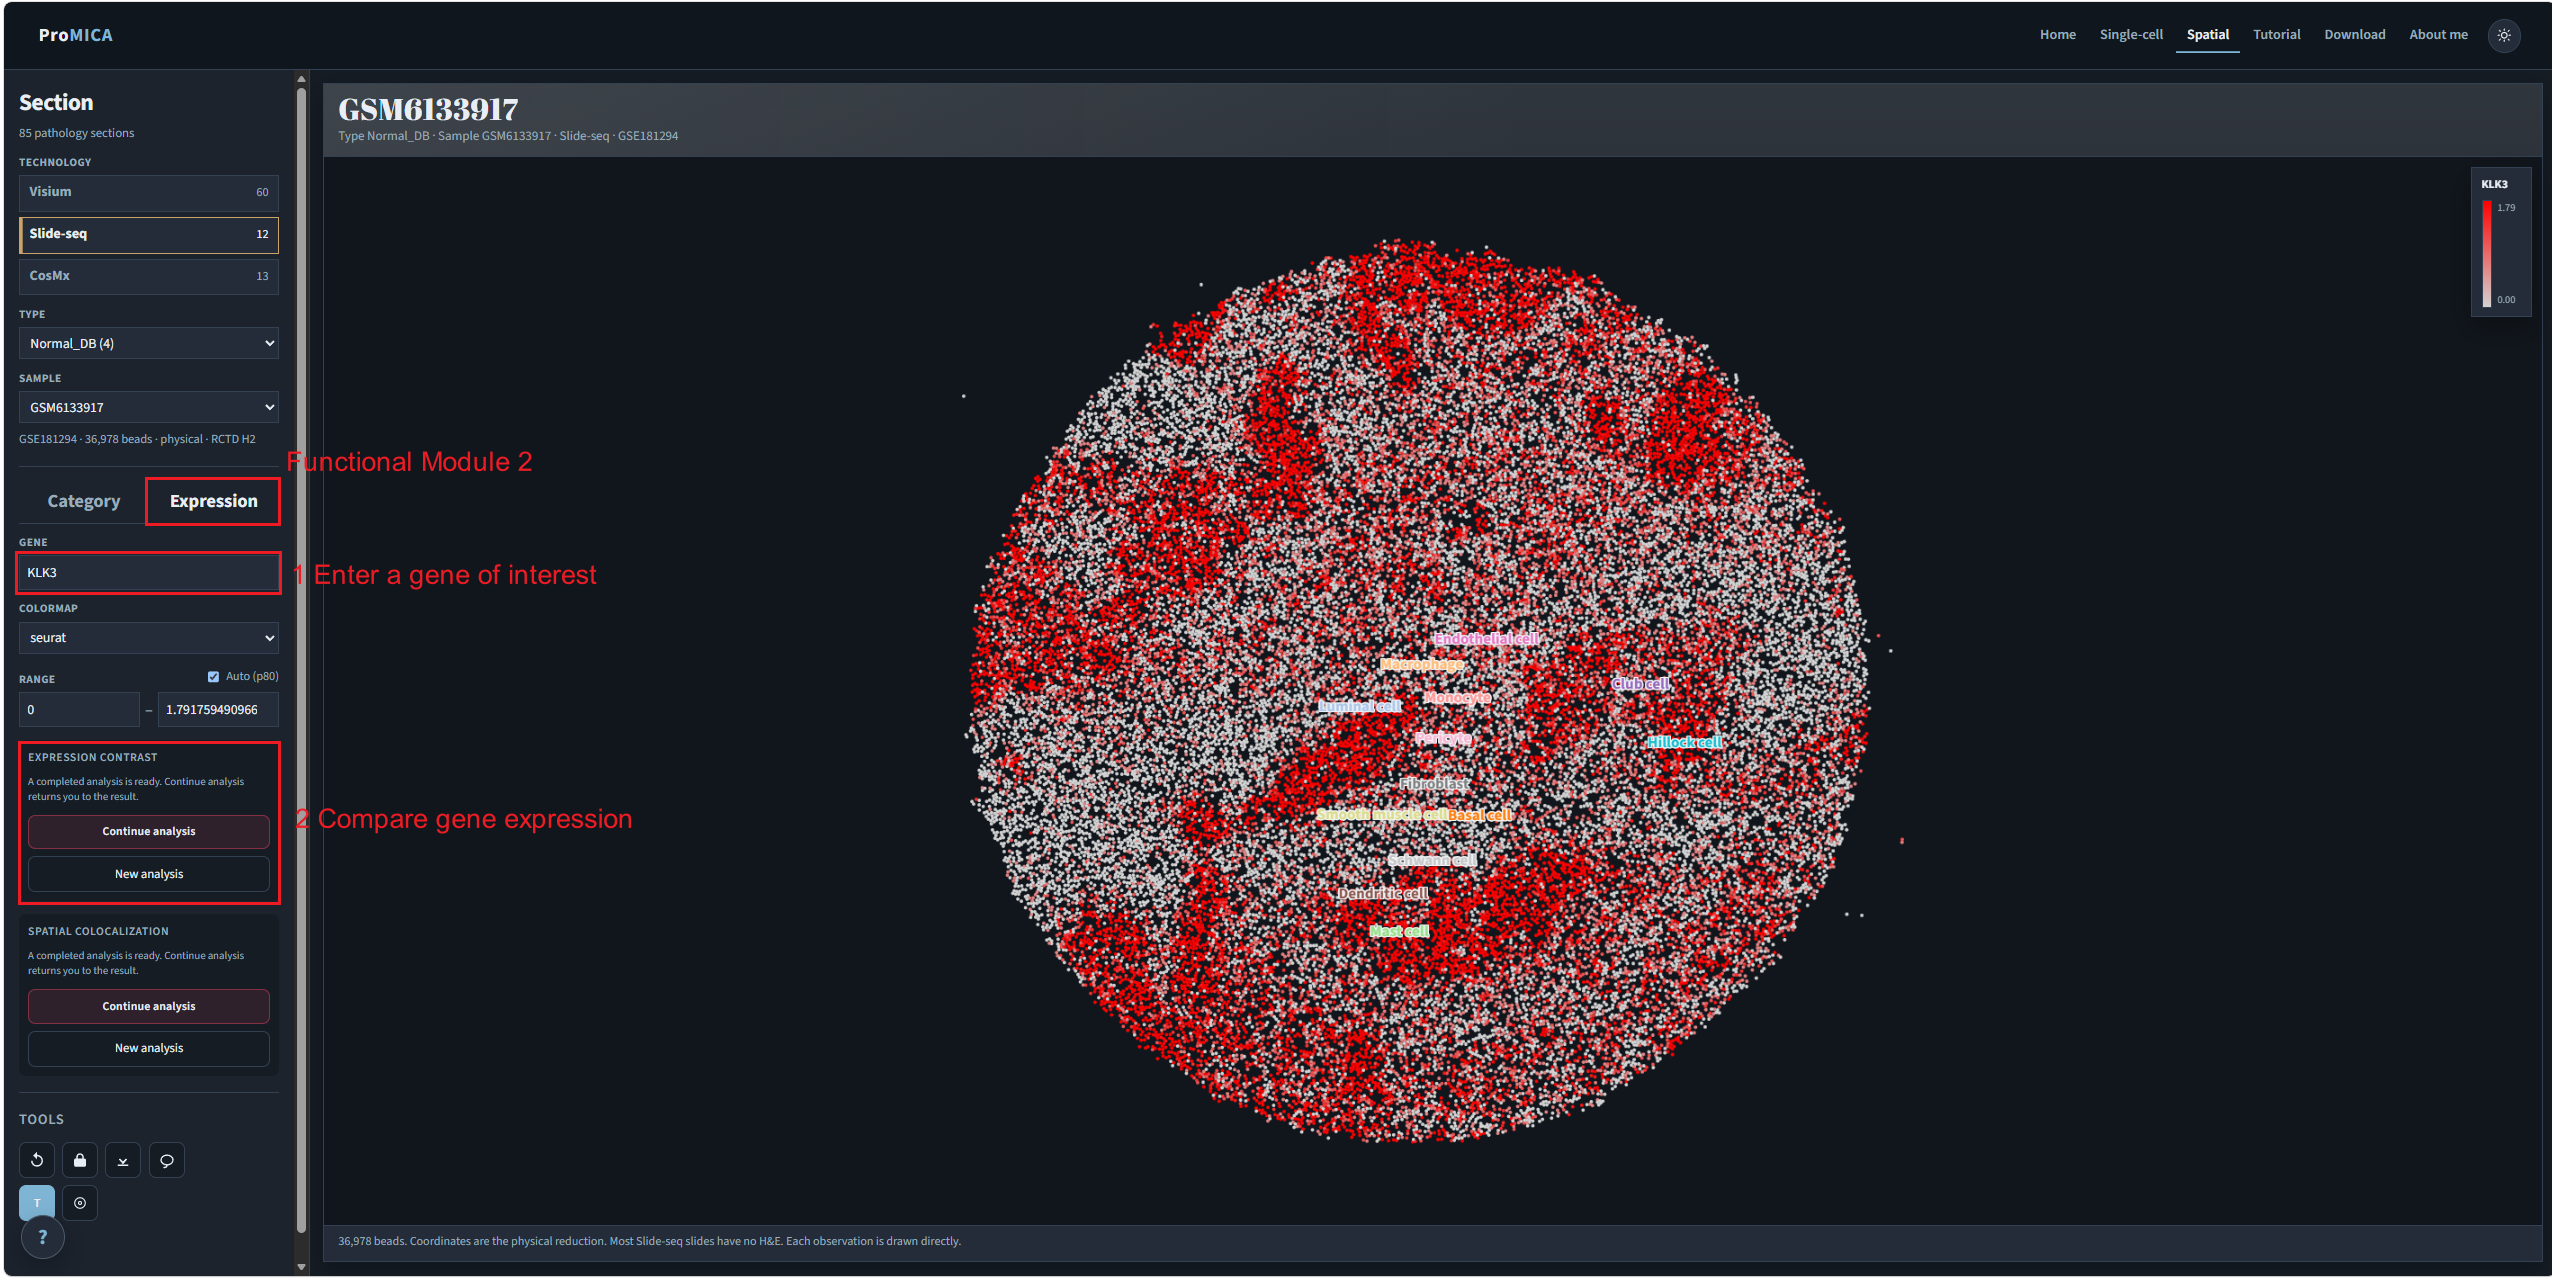
Open the Expression tab, enter a gene symbol, then continue into expression contrast to compare two regions on the section.
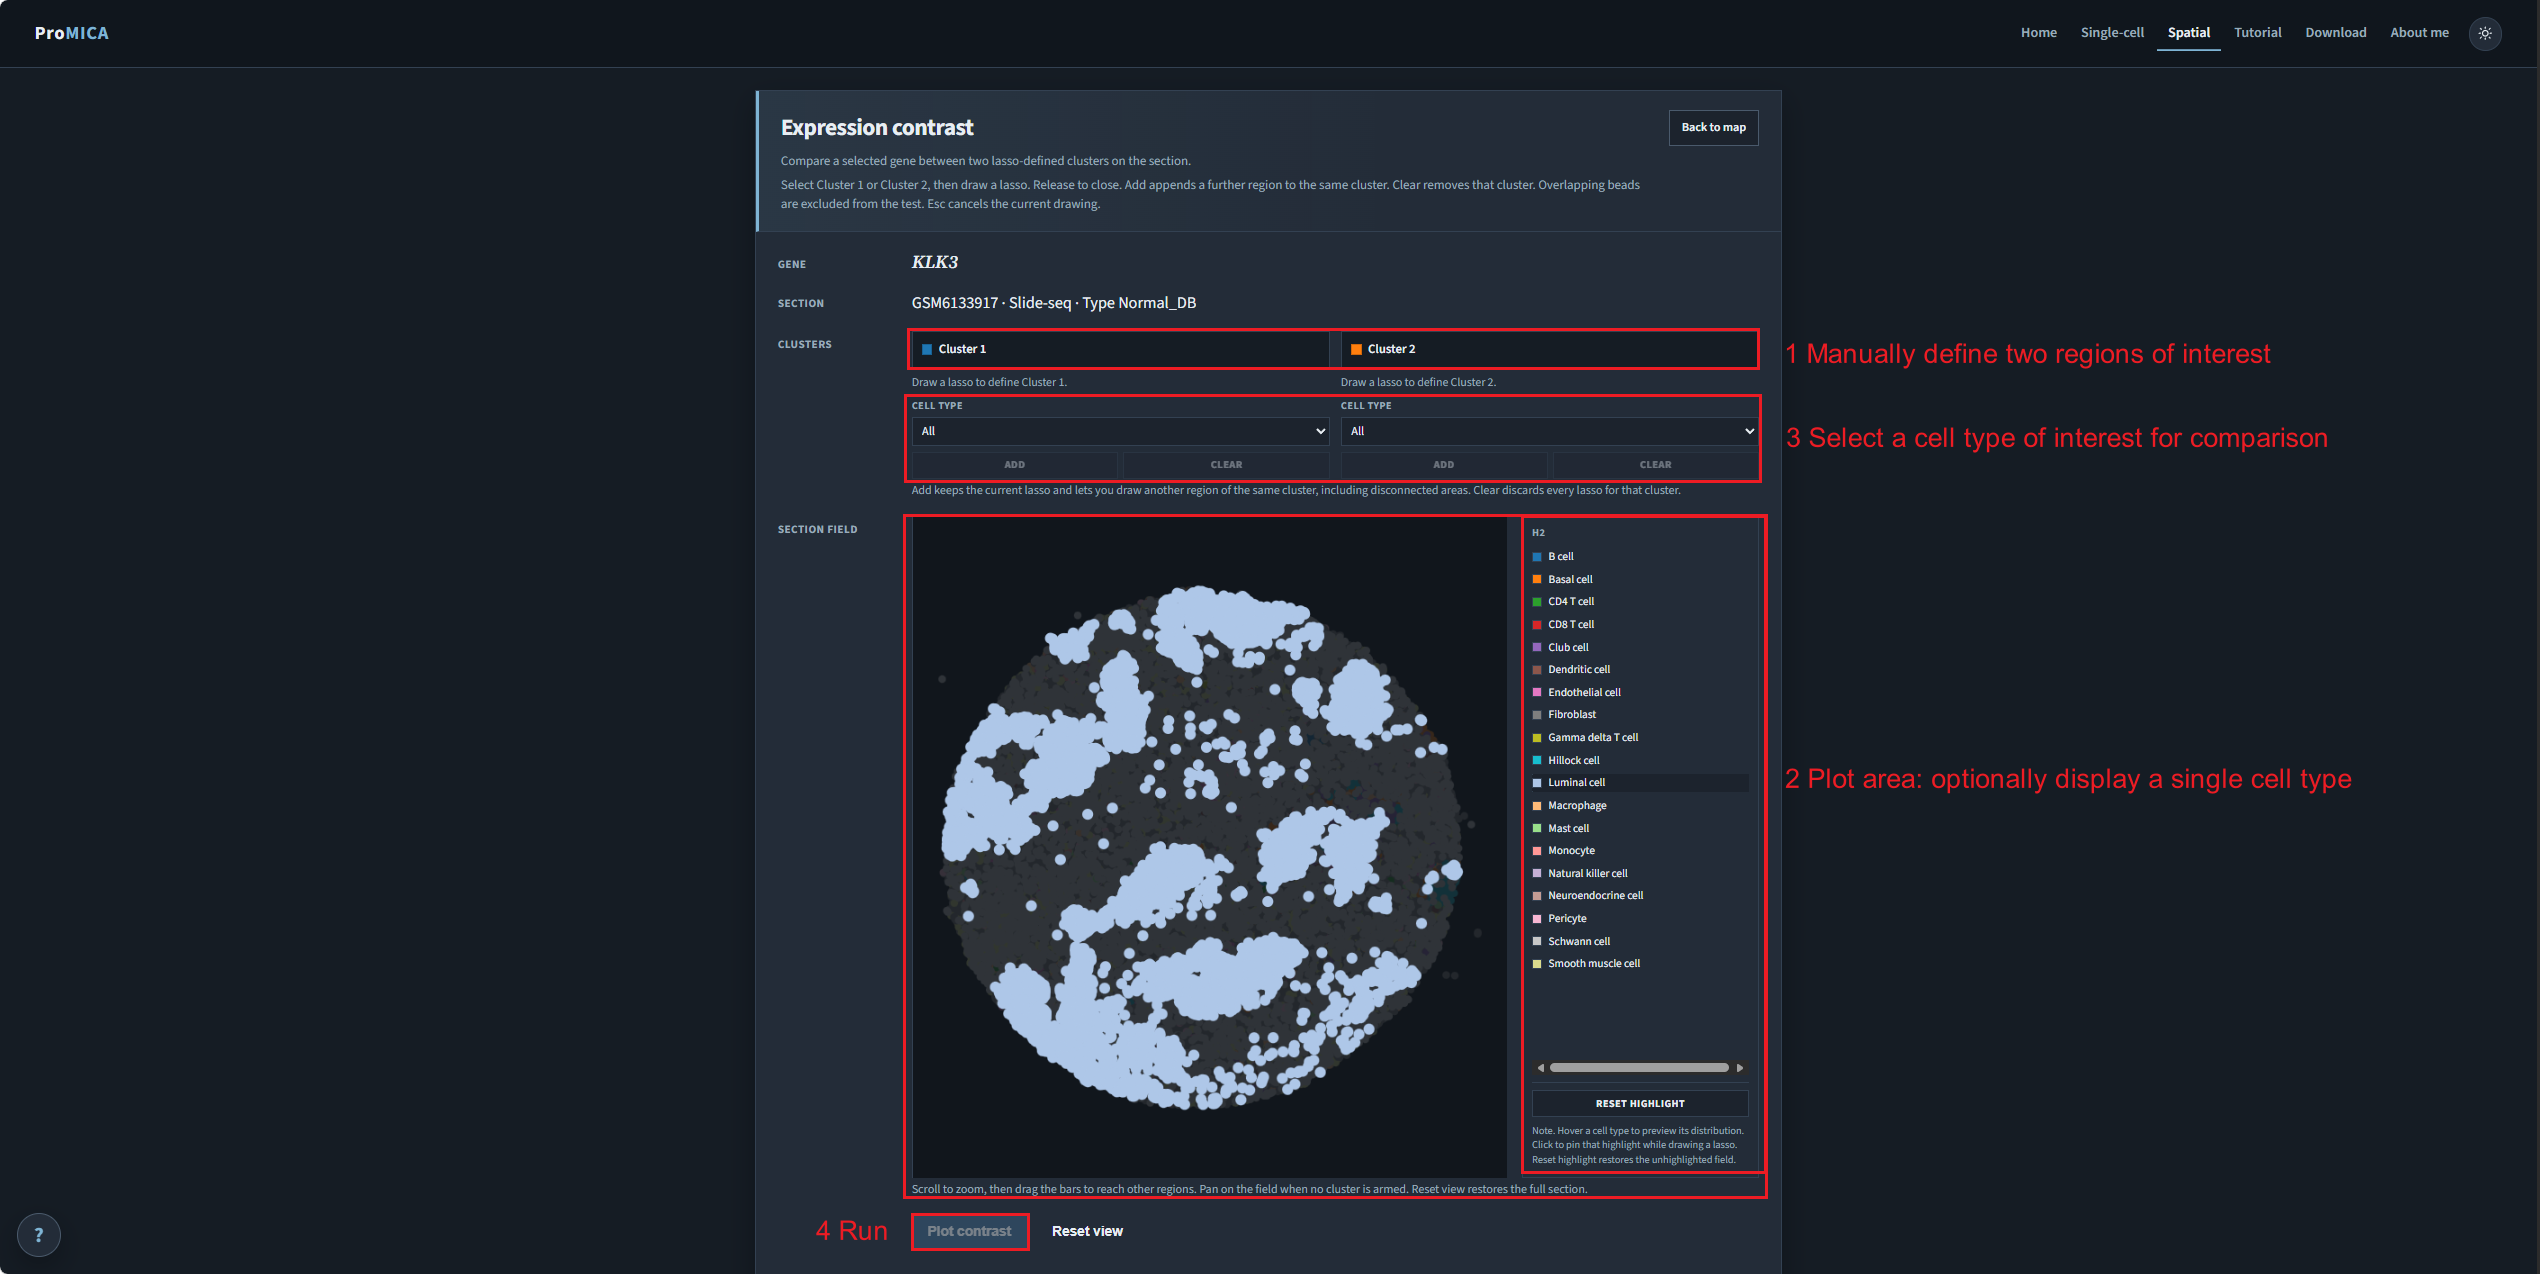
Draw two regions, optionally restrict each cluster to a cell type, then plot the contrast.
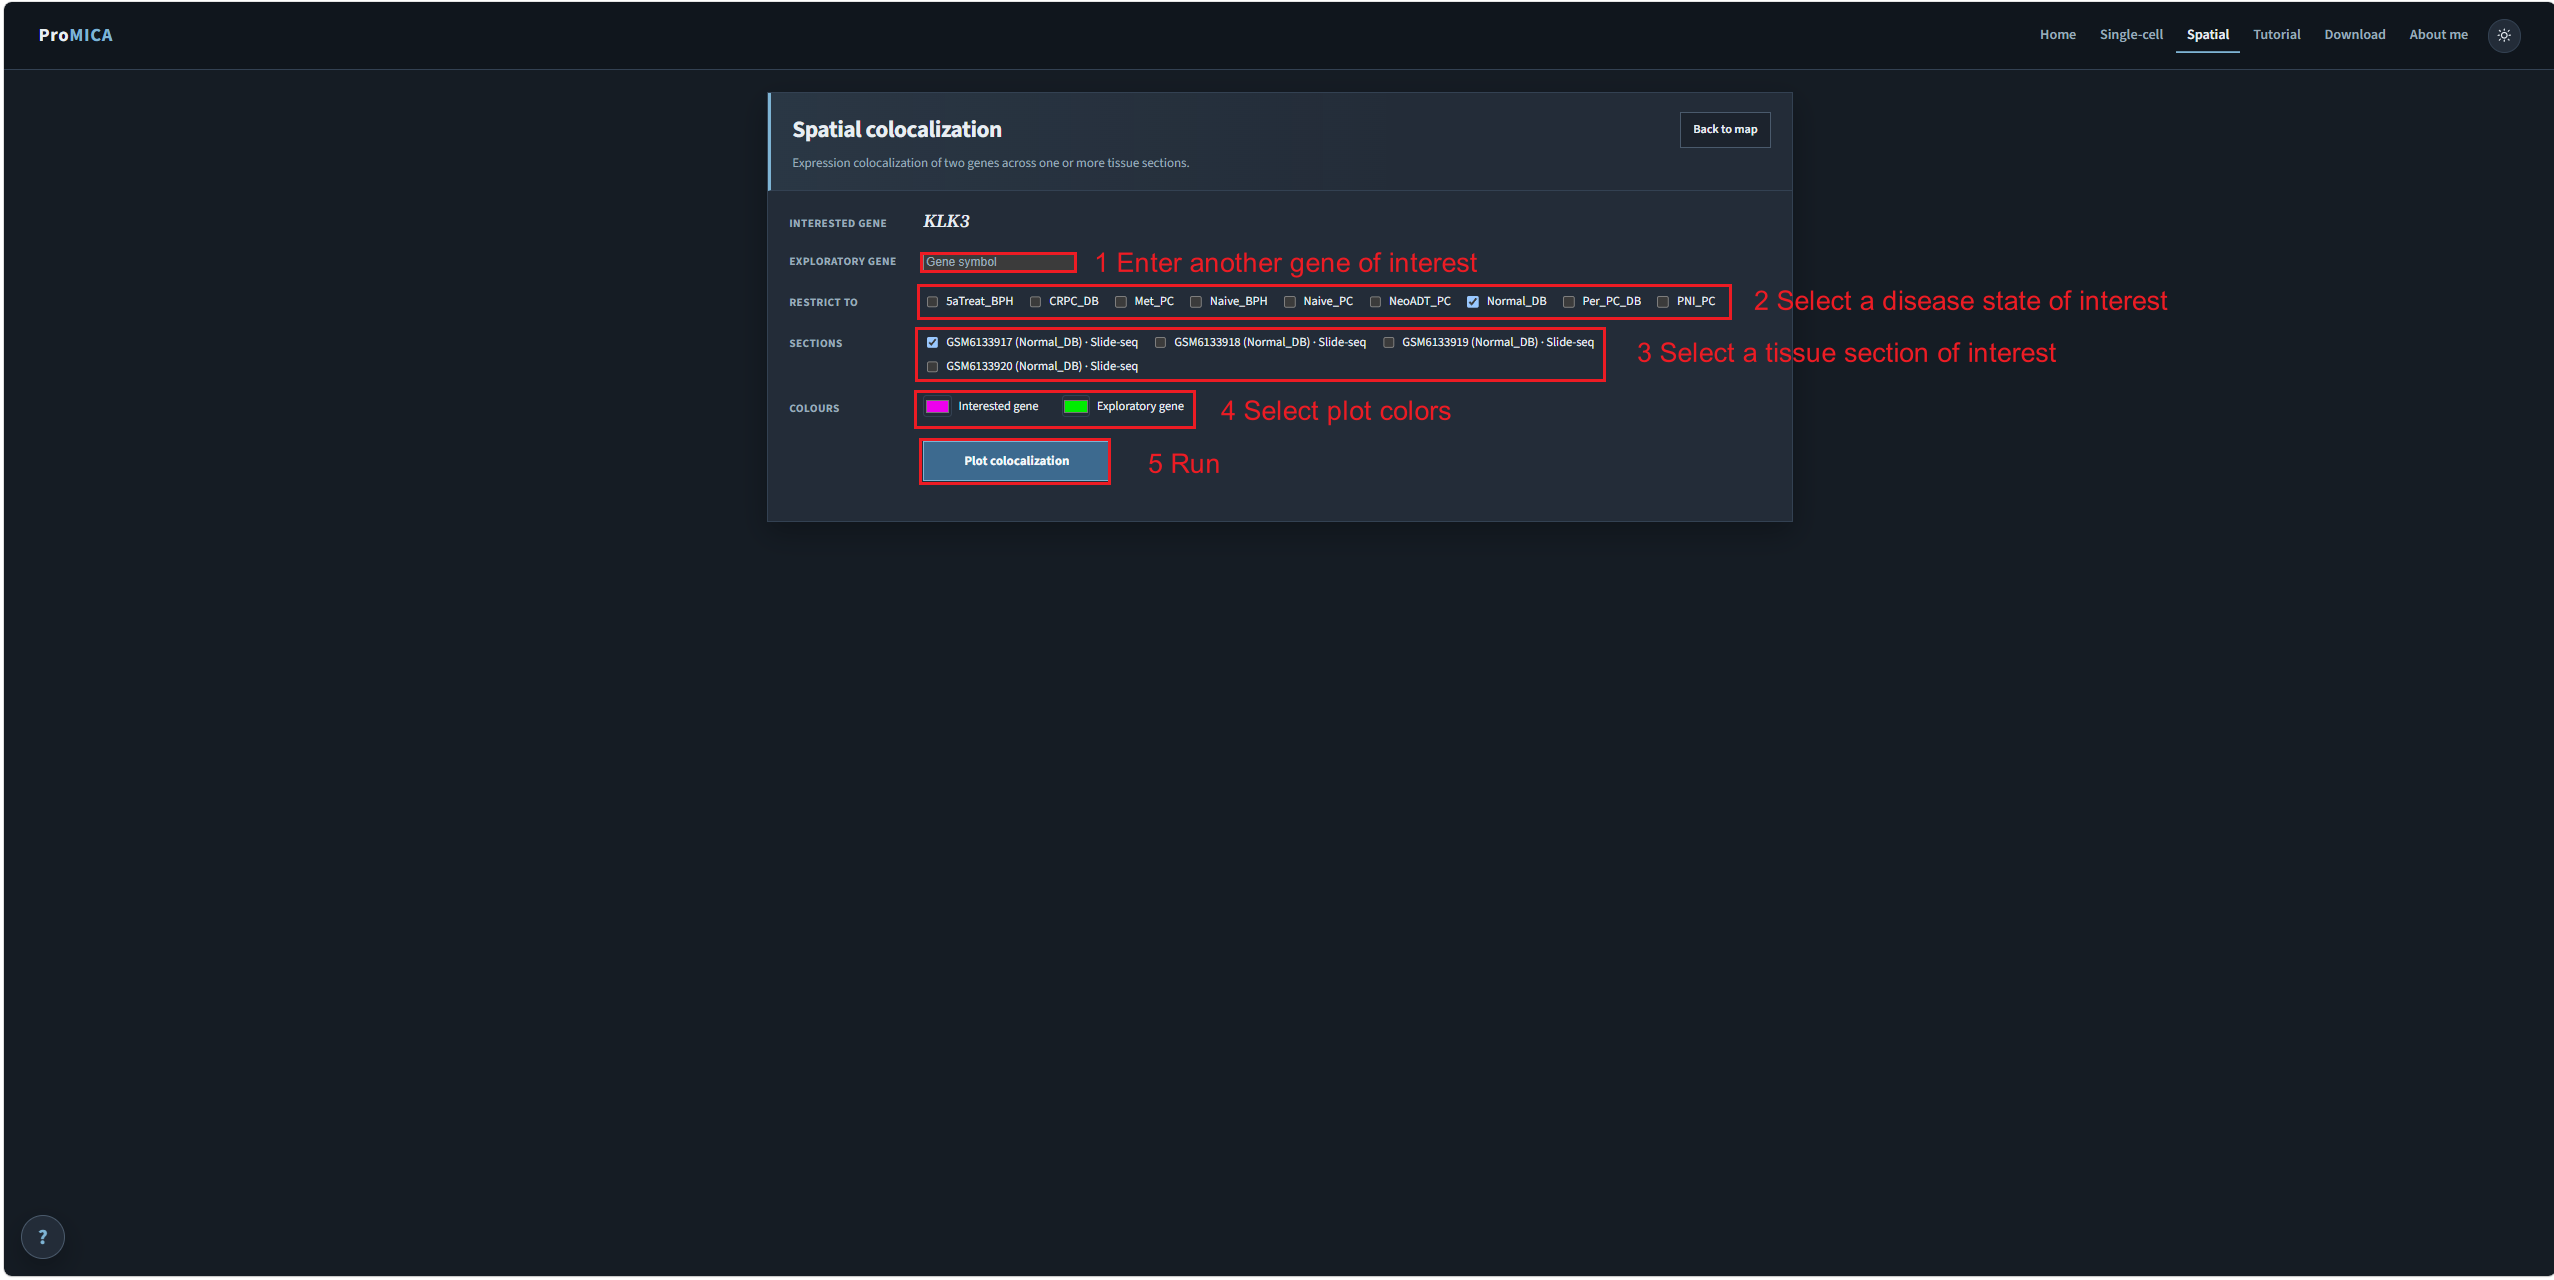
From the Expression tab, continue into colocalization to compare the plotted gene with a second gene across sections.
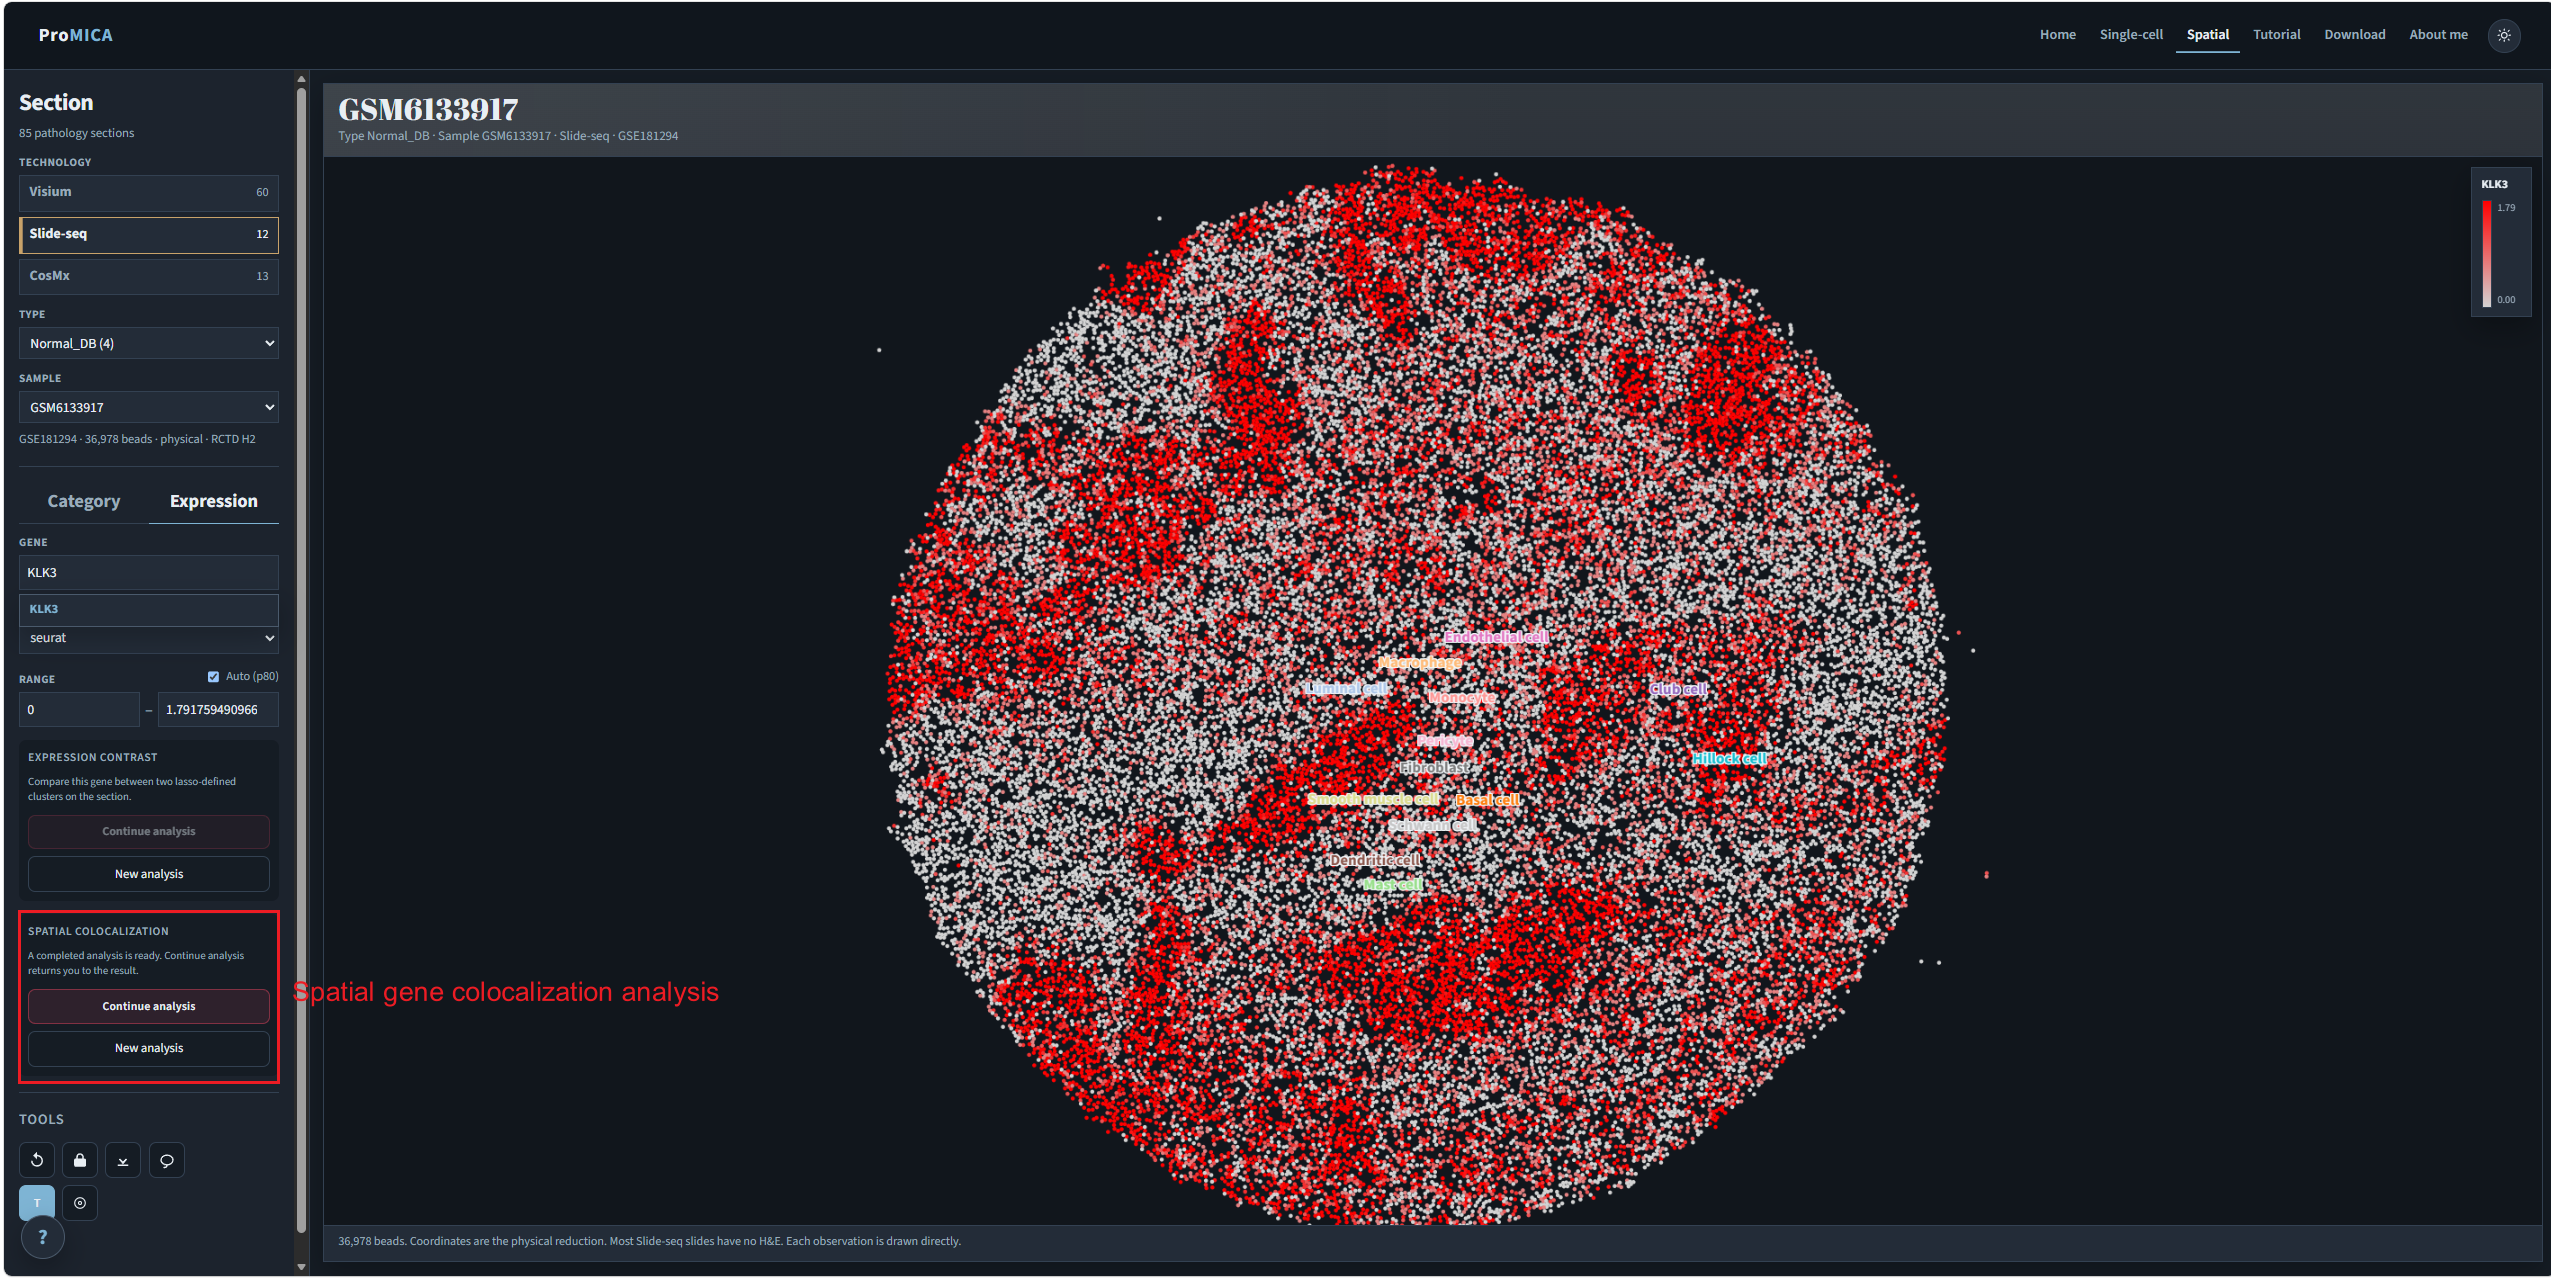
Enter the exploratory gene, restrict by disease state if needed, choose sections and colours, then plot.
Walkthrough 03
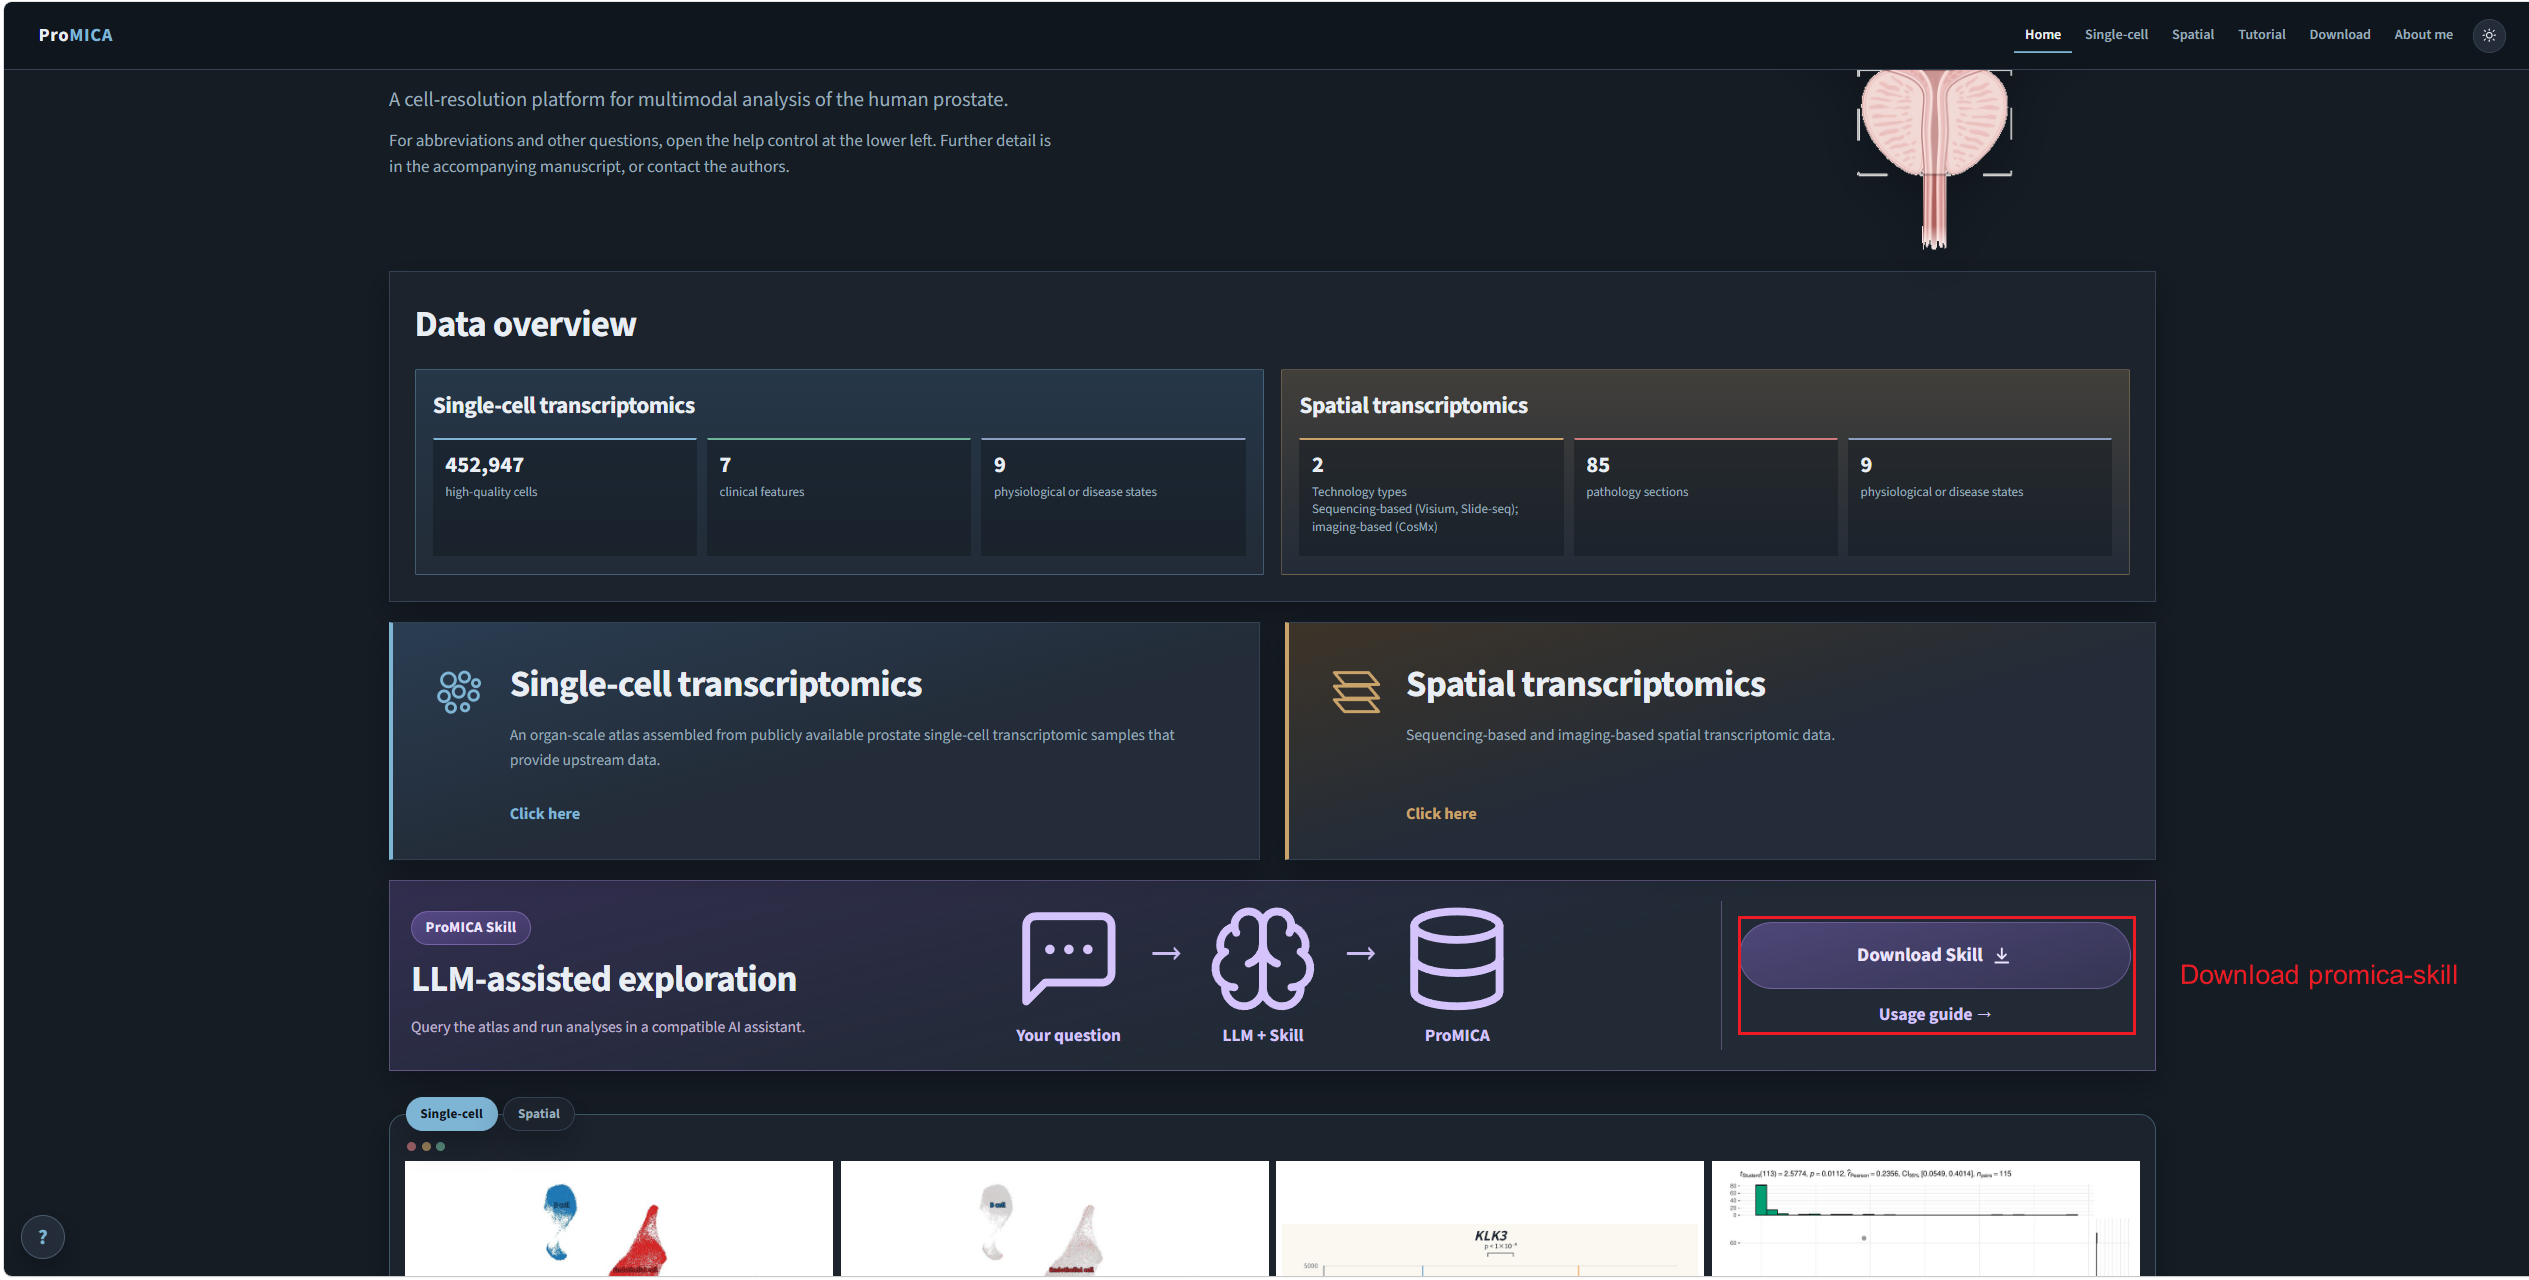
Start from the home page, download the archive, and provide the complete folder to an AI assistant that can issue HTTP requests.
On the home page, use Download Skill on the ProMICA Skill card to obtain the archive.
Extract the archive and place the promica-skill folder in the assistant’s skills directory.
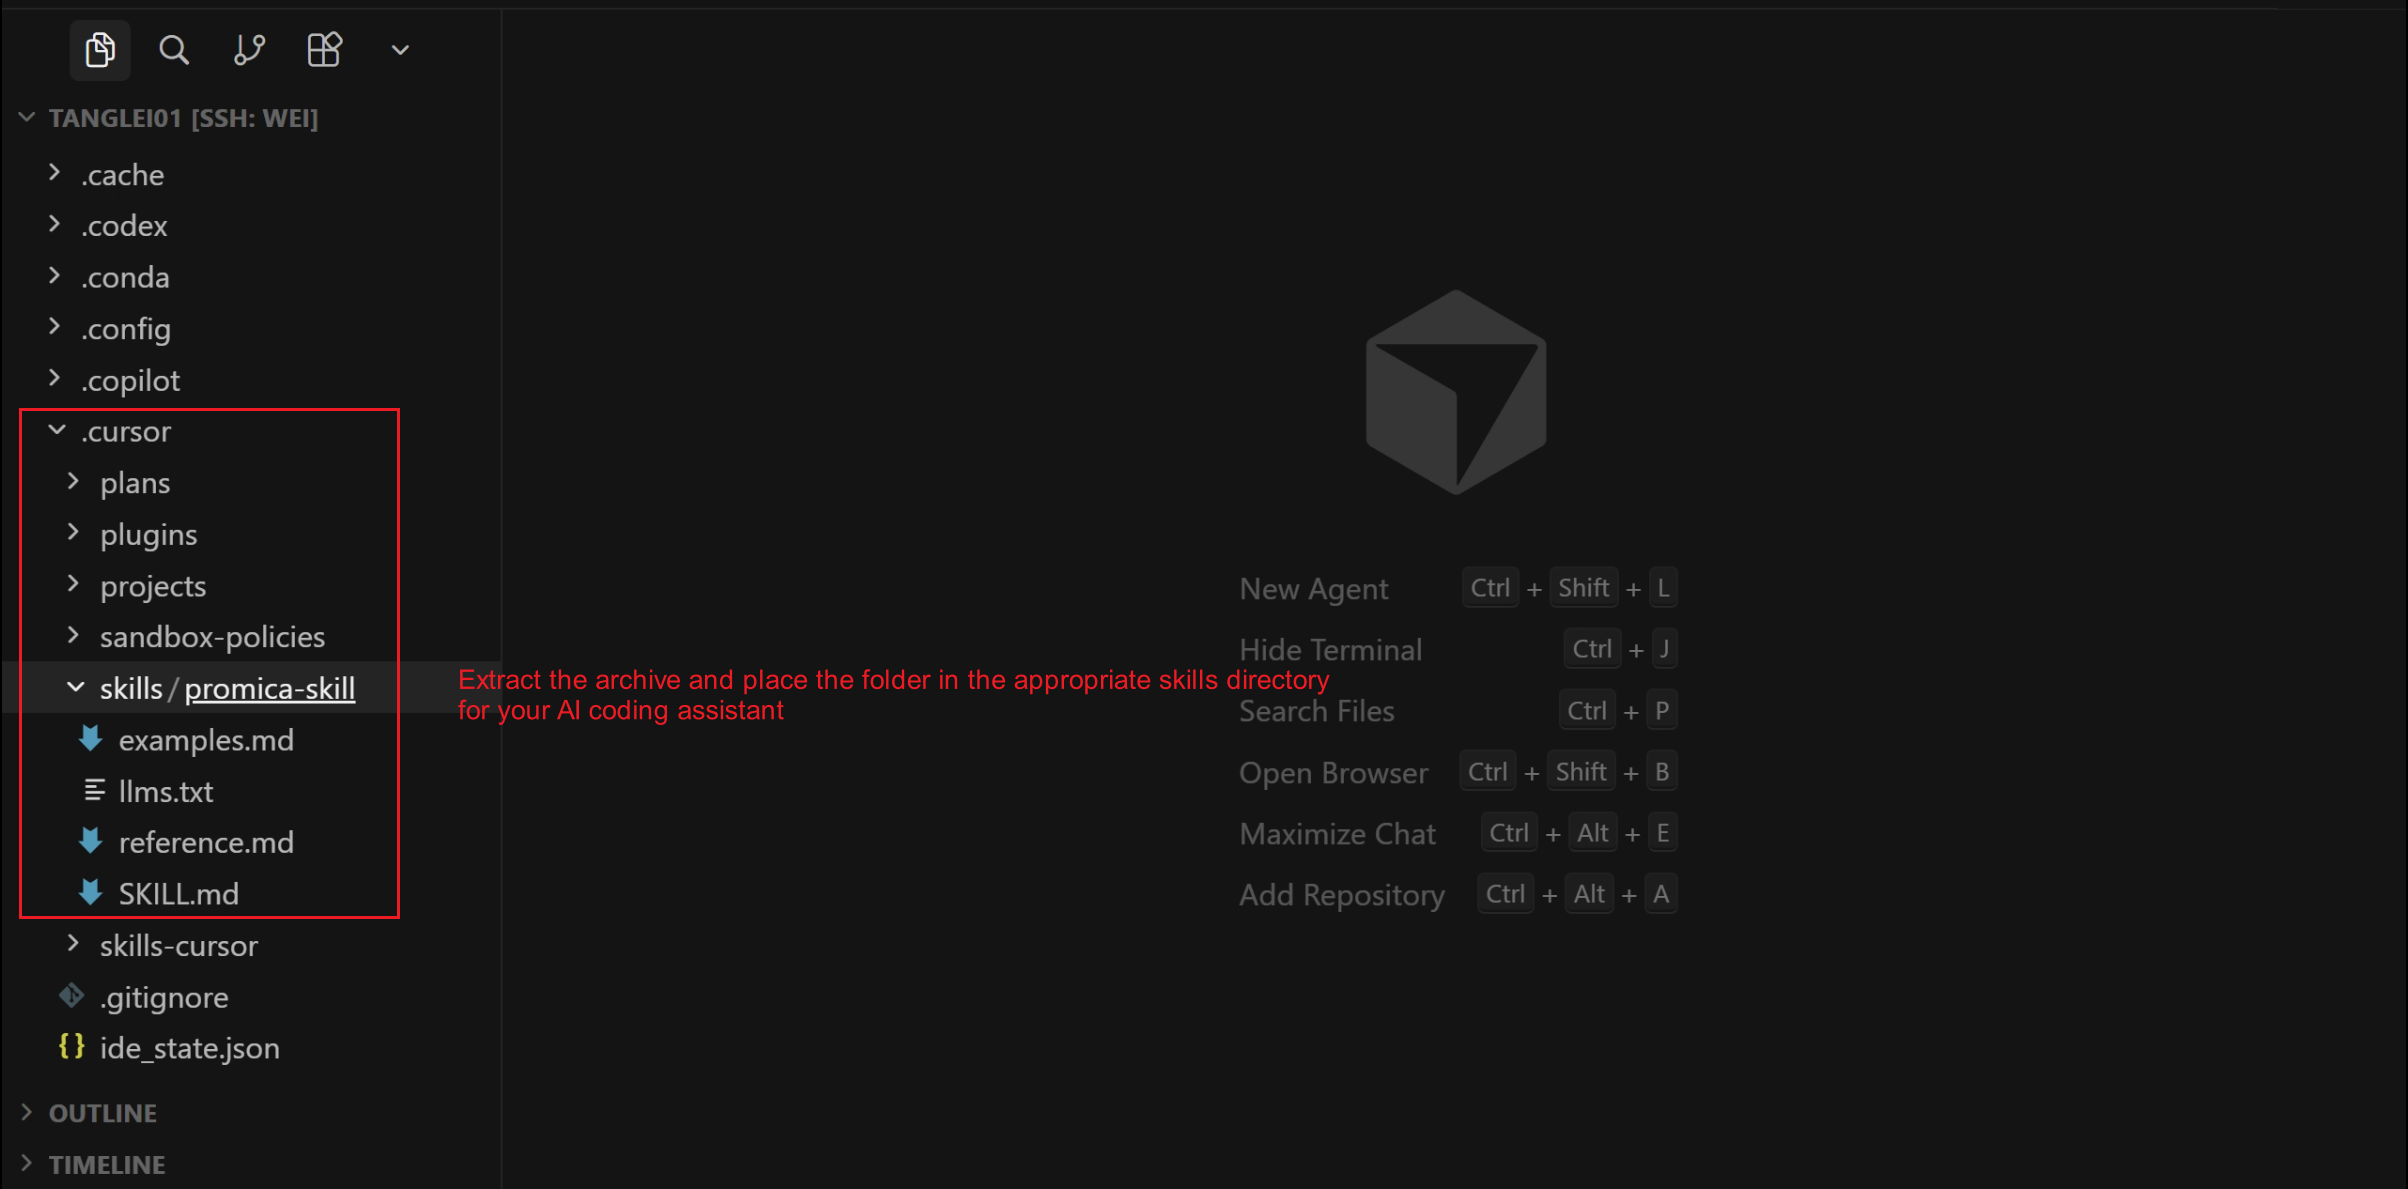
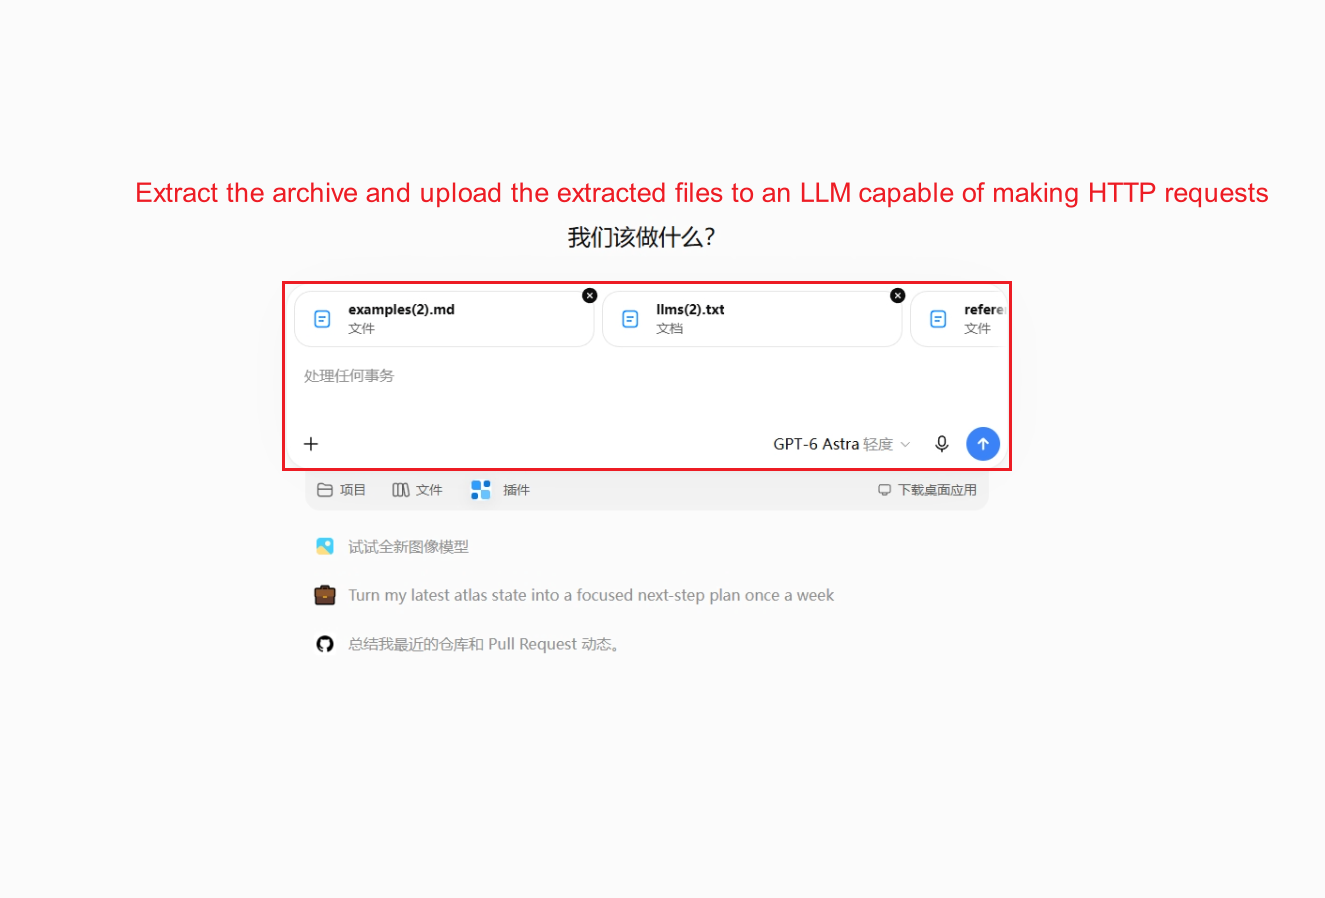
Extract the archive and upload all four files to a language model that can issue HTTP requests.